| | |
| | |

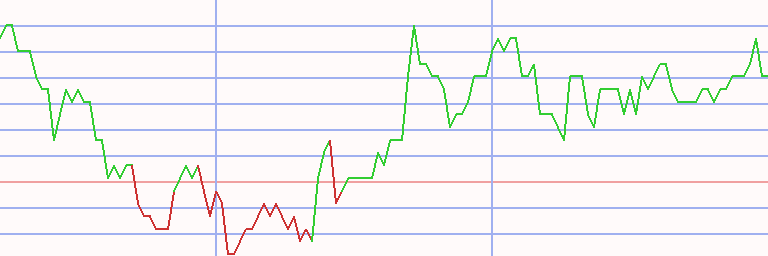
Assessment - Swiss Market Index in Euro - 7/01/24 - RS = 46
⇐
| |
|
⇓instrument |
freshest |
⇓ Δday |
7/01/24 |
⇓ Δwk |
8/14/23 |
prc diff |
⇓ Δ46 |
|
∅-RS |
| |  |
 |
 |
|
L |
 |
SMI® PR |
12,250.399 |
8/12/24 |
0.07 |
12,431.880 |
-1.46 |
11,592.825 |
839.055 |
7.24 |
|
6.40 |
| | |
|
|
|
L |
|
ABB |
46.954 |
8/12/24 |
0.55 |
51.978 |
-9.67 |
35.467 |
16.511 |
46.55 |
|
34.33 |
| | |
|
|
|
L |
|
Givaudan |
4,268.249 |
8/12/24 |
-1.12 |
4,438.483 |
-3.84 |
2,989.482 |
1,449.001 |
48.47 |
|
26.75 |
| | |
|
|
|
L |
|
Logitech |
77.668 |
8/12/24 |
1.95 |
89.966 |
-13.67 |
62.043 |
27.923 |
45.01 |
|
22.94 |
| | |
|
|
|
|
|
Holcim |
78.700 |
8/12/24 |
-0.34 |
82.435 |
-4.53 |
62.523 |
19.911 |
31.85 |
|
20.32 |
| | |
|
|
|
|
|
UBS |
25.638 |
8/12/24 |
0.44 |
27.836 |
-7.89 |
21.599 |
6.237 |
28.87 |
|
13.41 |
| | |
|
|
|
L |
|
Richemont |
132.267 |
8/12/24 |
1.22 |
145.009 |
-8.79 |
135.074 |
9.935 |
7.35 |
|
10.49 |
| | |
|
|
|
|
|
Swiss Re |
107.299 |
8/12/24 |
0.10 |
115.966 |
-7.47 |
89.278 |
26.688 |
29.89 |
|
12.97 |
| | |
|
|
|
L |
|
Alcon |
82.084 |
8/12/24 |
-1.12 |
82.724 |
-0.77 |
74.836 |
7.888 |
10.54 |
|
12.16 |
| | |
|
|
|
L |
|
Geberit |
539.386 |
8/12/24 |
-0.72 |
545.989 |
-1.21 |
497.412 |
48.577 |
9.77 |
|
6.80 |
| | |
|
|
|
|
|
Swiss Life |
672.891 |
8/12/24 |
0.62 |
690.431 |
-2.54 |
578.071 |
112.360 |
19.44 |
|
12.83 |
| | |
|
|
|
L |
|
Sonova |
286.923 |
8/12/24 |
-1.52 |
289.193 |
-0.78 |
246.567 |
42.626 |
17.29 |
|
10.96 |
| | |
|
|
|
|
|
Lonza |
562.290 |
8/12/24 |
-1.80 |
503.895 |
11.59 |
515.673 |
-11.778 |
-2.28 |
|
10.98 |
| | |
|
|
|
L |
|
Zurich Insurance |
479.443 |
8/12/24 |
0.85 |
498.117 |
-3.75 |
432.718 |
65.399 |
15.11 |
|
8.61 |
| | |
|
|
|
|
|
Partners |
1,170.493 |
8/12/24 |
0.93 |
1,183.905 |
-1.13 |
1,000.876 |
183.029 |
18.29 |
|
4.32 |
| | |
|
|
|
L |
|
Novartis |
99.809 |
8/12/24 |
0.16 |
99.788 |
0.02 |
94.870 |
4.918 |
5.18 |
|
7.93 |
| | |
|
|
|
|
|
Sika |
255.249 |
8/12/24 |
0.04 |
263.193 |
-3.02 |
273.905 |
-10.712 |
-3.91 |
|
0.89 |
| | |
|
|
|
L |
|
Roche |
286.613 |
8/12/24 |
0.25 |
258.035 |
11.08 |
276.358 |
-18.323 |
-6.63 |
|
1.75 |
| | |
|
|
|
|
|
Kühne & Nagel |
261.852 |
8/12/24 |
0.40 |
269.796 |
-2.94 |
286.322 |
-16.526 |
-5.77 |
|
-1.32 |
| | |
|
|
|
L |
|
Nestlé |
91.452 |
8/12/24 |
-0.40 |
94.795 |
-3.53 |
109.040 |
-14.245 |
-13.06 |
|
-8.29 |
| | |
|
|
|
|
|
Swisscom |
541.656 |
8/12/24 |
0.48 |
524.632 |
3.24 |
557.619 |
-32.987 |
-5.92 |
|
-3.60 |
| SMI - 20 out of 20 instruments rated - 7/01/24 / 8/14/23 - 14 did rise, Market-Ratio(46) in EUR = 70.00 % |
| Stock Exchange Currency: CHF ₣ Swiss Franc |
Technical Chart
Transactions Swiss Market Index in Euro * L46 - 29 ex 13 (1)
|
⇐ |
| |
| L/S | date buy | date sell | days | | instrument | spl | pieces | | prc buy | prc sell | | prc diff | d % | asset | yield | | | long |
1/02/06 |
1/14/08 |
742 |
|
|
|
ABB |
100 |
1,188 |
|
8.416 |
17.782 |
|
9.366 |
111 |
21,127 |
44 |
|
| 1/14/08 |
2/04/08 |
21 |
|
- cash - |
| |
2/04/08 |
2/11/08 |
7 |
|
|
|
Lonza |
100 |
249 |
|
84.827 |
85.927 |
|
1.100 |
1 |
21,401 |
96 |
|
| 2/11/08 |
8/17/09 |
553 |
|
- cash - |
| |
8/17/09 |
9/27/10 |
406 |
|
|
|
Sonova |
100 |
354 |
|
60.427 |
91.320 |
|
30.893 |
51 |
32,337 |
45 |
|
| |
9/27/10 |
6/27/11 |
273 |
|
|
|
Richemont |
100 |
944 |
|
34.236 |
43.914 |
|
9.678 |
28 |
41,473 |
39 |
|
| 6/27/11 |
7/04/11 |
7 |
|
- cash - |
| |
7/04/11 |
8/01/11 |
28 |
|
|
|
Richemont |
100 |
918 |
|
45.174 |
42.548 |
|
-2.626 |
-6 |
39,062 |
-54 |
|
| 8/01/11 |
2/06/12 |
189 |
|
- cash - |
| |
2/06/12 |
2/20/12 |
14 |
|
|
|
Sonova |
100 |
478 |
|
81.712 |
85.291 |
|
3.579 |
4 |
40,773 |
206 |
|
| 2/20/12 |
3/05/12 |
14 |
|
- cash - |
| |
3/05/12 |
3/12/12 |
7 |
|
|
|
Sonova |
100 |
485 |
|
83.955 |
84.259 |
|
0.304 |
0 |
40,921 |
21 |
|
| 3/12/12 |
3/19/12 |
7 |
|
- cash - |
| |
3/19/12 |
4/23/12 |
35 |
|
|
|
Swiss Re |
100 |
844 |
|
48.450 |
46.064 |
|
-2.386 |
-5 |
38,907 |
-41 |
|
| 4/23/12 |
4/30/12 |
7 |
|
- cash - |
| |
4/30/12 |
5/13/13 |
378 |
|
|
|
Swiss Re |
100 |
821 |
|
47.361 |
58.348 |
|
10.987 |
23 |
47,927 |
22 |
|
| |
5/13/13 |
9/28/15 |
868 |
|
|
|
Lonza |
100 |
824 |
|
58.147 |
117.717 |
|
59.570 |
102 |
97,012 |
35 |
|
| 9/28/15 |
10/05/15 |
7 |
|
- cash - |
| |
10/05/15 |
1/18/16 |
105 |
|
|
|
Partners |
100 |
310 |
|
312.386 |
323.744 |
|
11.359 |
4 |
100,534 |
13 |
|
| 1/18/16 |
1/25/16 |
7 |
|
- cash - |
| |
1/25/16 |
2/08/16 |
14 |
|
|
|
Lonza |
100 |
698 |
|
143.858 |
126.086 |
|
-17.772 |
-12 |
88,129 |
-97 |
|
| 2/08/16 |
3/07/16 |
28 |
|
- cash - |
| |
3/07/16 |
12/04/17 |
637 |
|
|
|
Logitech |
100 |
5,873 |
|
15.005 |
28.114 |
|
13.109 |
87 |
165,119 |
43 |
|
| |
12/04/17 |
10/22/18 |
322 |
|
|
|
Sika |
100 |
1,538 |
|
107.342 |
106.300 |
|
-1.042 |
-1 |
163,517 |
-1 |
|
| |
10/22/18 |
4/22/19 |
182 |
|
|
|
Lonza |
100 |
590 |
|
277.133 |
260.099 |
|
-17.034 |
-6 |
153,467 |
-12 |
|
| |
4/22/19 |
12/16/19 |
238 |
|
|
|
Swiss Life |
100 |
369 |
|
415.774 |
450.036 |
|
34.262 |
8 |
166,109 |
13 |
|
| |
12/16/19 |
3/16/20 |
91 |
|
|
|
Geberit |
100 |
332 |
|
499.046 |
366.157 |
|
-132.889 |
-27 |
121,990 |
-71 |
|
| 3/16/20 |
3/30/20 |
14 |
|
- cash - |
| |
3/30/20 |
5/04/20 |
35 |
|
|
|
Lonza |
100 |
327 |
|
372.187 |
413.050 |
|
40.863 |
11 |
135,352 |
196 |
|
| 5/04/20 |
5/11/20 |
7 |
|
- cash - |
| |
5/11/20 |
3/01/21 |
294 |
|
|
|
Lonza |
100 |
317 |
|
426.819 |
509.442 |
|
82.623 |
19 |
161,544 |
25 |
|
| |
3/01/21 |
8/23/21 |
175 |
|
|
|
Logitech |
100 |
1,886 |
|
85.628 |
90.884 |
|
5.256 |
6 |
171,456 |
13 |
|
| |
8/23/21 |
1/10/22 |
140 |
|
|
|
Partners |
100 |
113 |
|
1,507.885 |
1,263.464 |
|
-244.421 |
-16 |
143,836 |
-37 |
|
| |
1/10/22 |
5/23/22 |
133 |
|
|
|
Richemont |
100 |
1,137 |
|
126.489 |
89.659 |
|
-36.831 |
-29 |
101,960 |
-61 |
|
| |
5/23/22 |
6/13/22 |
21 |
|
|
|
UBS |
100 |
5,917 |
|
17.229 |
15.443 |
|
-1.786 |
-10 |
91,393 |
-85 |
|
| 6/13/22 |
8/01/22 |
49 |
|
- cash - |
| |
8/01/22 |
8/29/22 |
28 |
|
|
|
Alcon |
100 |
1,197 |
|
76.308 |
65.897 |
|
-10.411 |
-14 |
78,930 |
-85 |
|
| 8/29/22 |
1/16/23 |
140 |
|
- cash - |
| |
1/16/23 |
2/06/23 |
21 |
|
|
|
Richemont |
100 |
568 |
|
138.763 |
141.566 |
|
2.803 |
2 |
80,522 |
42 |
|
| L/S | date buy | date sell | days | | instrument | spl | pieces | | prc buy | prc sell | | prc diff | d % | asset | yield | |
| 2/06/23 |
2/20/23 |
14 |
|
- cash - |
| |
2/20/23 |
9/11/23 |
203 |
|
|
|
Richemont |
100 |
552 |
|
145.645 |
122.225 |
|
-23.420 |
-16 |
67,594 |
-27 |
|
| |
9/11/23 |
8/12/24 |
336 |
|
|
|
UBS |
100 |
2,828 |
|
23.902 |
25.638 |
|
1.737 |
7 |
72,506 |
8 |
|
| accum | 1/02/06 |
8/12/24 | 6410 |
days out of 7474 invested (86%) |
625 |
72,506 |
12 |
|
Instrument Related Contribution
| instrument | L/S | date buy | date sell | days | prc buy | prc sell | | prc diff | d % | | | total |
| Lonza | long | 2/04/08 | 2/11/08 | 7 | 84.83 | 85.93 | | 1.10 | 1.30 | | | |
| | | 5/13/13 | 9/28/15 | 868 | 58.15 | 117.72 | | 59.57 | 102.45 | | | |
| | | 1/25/16 | 2/08/16 | 14 | 143.86 | 126.09 | | -17.77 | -12.35 | | | |
| | | 10/22/18 | 4/22/19 | 182 | 277.13 | 260.10 | | -17.03 | -6.15 | | | |
| | | 3/30/20 | 5/04/20 | 35 | 372.19 | 413.05 | | 40.86 | 10.98 | | | |
| | | 5/11/20 | 3/01/21 | 294 | 426.82 | 509.44 | | 82.62 | 19.36 | | | 123.45 |
| ABB | | 1/02/06 | 1/14/08 | 742 | 8.42 | 17.78 | | 9.37 | 111.29 | | | 111.29 |
| Logitech | | 3/07/16 | 12/04/17 | 637 | 15.01 | 28.11 | | 13.11 | 87.37 | | | |
| | | 3/01/21 | 8/23/21 | 175 | 85.63 | 90.88 | | 5.26 | 6.14 | | | 98.87 |
| Sonova | | 8/17/09 | 9/27/10 | 406 | 60.43 | 91.32 | | 30.89 | 51.13 | | | |
| | | 2/06/12 | 2/20/12 | 14 | 81.71 | 85.29 | | 3.58 | 4.38 | | | |
| | | 3/05/12 | 3/12/12 | 7 | 83.95 | 84.26 | | 0.30 | 0.36 | | | 58.32 |
| Swiss Re | | 3/19/12 | 4/23/12 | 35 | 48.45 | 46.06 | | -2.39 | -4.93 | | | |
| | | 4/30/12 | 5/13/13 | 378 | 47.36 | 58.35 | | 10.99 | 23.20 | | | 17.13 |
| Swiss Life | | 4/22/19 | 12/16/19 | 238 | 415.77 | 450.04 | | 34.26 | 8.24 | | | 8.24 |
| Sika | | 12/04/17 | 10/22/18 | 322 | 107.34 | 106.30 | | -1.04 | -0.97 | | | -0.97 |
| UBS | | 5/23/22 | 6/13/22 | 21 | 17.23 | 15.44 | | -1.79 | -10.37 | | | |
| | | 9/11/23 | 8/12/24 | 336 | 23.90 | 25.64 | | 1.74 | 7.27 | | | -3.85 |
| Partners | | 10/05/15 | 1/18/16 | 105 | 312.39 | 323.74 | | 11.36 | 3.64 | | | |
| | | 8/23/21 | 1/10/22 | 140 | 1,507.88 | 1,263.46 | | -244.42 | -16.21 | | | -13.16 |
| Alcon | | 8/01/22 | 8/29/22 | 28 | 76.31 | 65.90 | | -10.41 | -13.64 | | | -13.64 |
| Geberit | | 12/16/19 | 3/16/20 | 91 | 499.05 | 366.16 | | -132.89 | -26.63 | | | -26.63 |
| Richemont | | 9/27/10 | 6/27/11 | 273 | 34.24 | 43.91 | | 9.68 | 28.27 | | | |
| | | 7/04/11 | 8/01/11 | 28 | 45.17 | 42.55 | | -2.63 | -5.81 | | | |
| | | 1/10/22 | 5/23/22 | 133 | 126.49 | 89.66 | | -36.83 | -29.12 | | | |
| | | 1/16/23 | 2/06/23 | 21 | 138.76 | 141.57 | | 2.80 | 2.02 | | | |
| | | 2/20/23 | 9/11/23 | 203 | 145.65 | 122.23 | | -23.42 | -16.08 | | | -26.68 |
Annotations
| 6/19/18 | Sika | | | stock split 1:60 (sixty for one) |
| 5/15/17 | SMI | | | Sika replaces Syngenta (acquired by ChemChina) |
| 5/03/17 | SMI | | | Lonza replaces Actelion (acquired by Johnson & Johnson) |
| 4/05/16 | SMI | | | Transocean was replaced by Swiss Life |
| 9/10/15 | SMI | | | complete analysis |
|
|