| | |
| | |

Assessment - Swiss Market Index in Euro - 7/01/24 - RS = 41
⇐
| |
|
⇓instrument |
freshest |
⇓ Δday |
7/01/24 |
⇓ Δwk |
9/18/23 |
prc diff |
⇓ Δ41 |
|
∅-RS |
| |  |
 |
 |
|
L |
 |
SMI® PR |
12,250.399 |
8/12/24 |
0.07 |
12,431.880 |
-1.46 |
11,565.961 |
865.919 |
7.49 |
|
6.40 |
| | |
|
|
|
L |
|
ABB |
46.954 |
8/12/24 |
0.55 |
51.978 |
-9.67 |
34.446 |
17.533 |
50.90 |
|
34.33 |
| | |
|
|
|
L |
|
Givaudan |
4,268.249 |
8/12/24 |
-1.12 |
4,438.483 |
-3.84 |
2,964.856 |
1,473.628 |
49.70 |
|
26.75 |
| | |
|
|
|
L |
|
Logitech |
77.668 |
8/12/24 |
1.95 |
89.966 |
-13.67 |
66.931 |
23.036 |
34.42 |
|
22.94 |
| | |
|
|
|
|
|
Holcim |
78.700 |
8/12/24 |
-0.34 |
82.435 |
-4.53 |
60.841 |
21.594 |
35.49 |
|
20.32 |
| | |
|
|
|
|
|
UBS |
25.638 |
8/12/24 |
0.44 |
27.836 |
-7.89 |
24.413 |
3.423 |
14.02 |
|
13.41 |
| | |
|
|
|
L |
|
Richemont |
132.267 |
8/12/24 |
1.22 |
145.009 |
-8.79 |
124.987 |
20.022 |
16.02 |
|
10.49 |
| | |
|
|
|
|
|
Swiss Re |
107.299 |
8/12/24 |
0.10 |
115.966 |
-7.47 |
97.695 |
18.271 |
18.70 |
|
12.97 |
| | |
|
|
|
L |
|
Alcon |
82.084 |
8/12/24 |
-1.12 |
82.724 |
-0.77 |
75.920 |
6.803 |
8.96 |
|
12.16 |
| | |
|
|
|
L |
|
Geberit |
539.386 |
8/12/24 |
-0.72 |
545.989 |
-1.21 |
472.103 |
73.886 |
15.65 |
|
6.80 |
| | |
|
|
|
|
|
Swiss Life |
672.891 |
8/12/24 |
0.62 |
690.431 |
-2.54 |
594.223 |
96.208 |
16.19 |
|
12.83 |
| | |
|
|
|
L |
|
Sonova |
286.923 |
8/12/24 |
-1.52 |
289.193 |
-0.78 |
228.282 |
60.910 |
26.68 |
|
10.96 |
| | |
|
|
|
|
|
Lonza |
562.290 |
8/12/24 |
-1.80 |
503.895 |
11.59 |
442.486 |
61.409 |
13.88 |
|
10.98 |
| | |
|
|
|
L |
|
Zurich Insurance |
479.443 |
8/12/24 |
0.85 |
498.117 |
-3.75 |
444.572 |
53.545 |
12.04 |
|
8.61 |
| | |
|
|
|
|
|
Partners |
1,170.493 |
8/12/24 |
0.93 |
1,183.905 |
-1.13 |
1,073.626 |
110.279 |
10.27 |
|
4.32 |
| | |
|
|
|
L |
|
Novartis |
99.809 |
8/12/24 |
0.16 |
99.788 |
0.02 |
95.964 |
3.824 |
3.99 |
|
7.93 |
| | |
|
|
|
|
|
Sika |
255.249 |
8/12/24 |
0.04 |
263.193 |
-3.02 |
251.017 |
12.176 |
4.85 |
|
0.89 |
| | |
|
|
|
L |
|
Roche |
286.613 |
8/12/24 |
0.25 |
258.035 |
11.08 |
269.006 |
-10.972 |
-4.08 |
|
1.75 |
| | |
|
|
|
|
|
Kühne & Nagel |
261.852 |
8/12/24 |
0.40 |
269.796 |
-2.94 |
278.548 |
-8.752 |
-3.14 |
|
-1.32 |
| | |
|
|
|
L |
|
Nestlé |
91.452 |
8/12/24 |
-0.40 |
94.795 |
-3.53 |
110.251 |
-15.456 |
-14.02 |
|
-8.29 |
| | |
|
|
|
|
|
Swisscom |
541.656 |
8/12/24 |
0.48 |
524.632 |
3.24 |
571.697 |
-47.064 |
-8.23 |
|
-3.60 |
| SMI - 20 out of 20 instruments rated - 7/01/24 / 9/18/23 - 16 did rise, Market-Ratio(41) in EUR = 80.00 % |
| Stock Exchange Currency: CHF ₣ Swiss Franc |
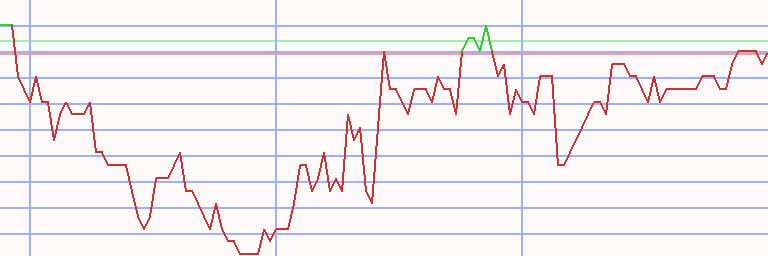
Technical Chart
Transactions Swiss Market Index in Euro * A41 - 84/79 (1)
|
⇐ |
| |
| L/S | date buy | date sell | days | | instrument | spl | pieces | | prc buy | prc sell | ps short | prc diff | d % | asset | yield | |
| 1/02/06 |
1/09/06 |
7 |
|
- cash - |
| long |
1/09/06 |
7/30/07 |
567 |
|
|
|
ABB |
100 |
1,106 |
|
9.039 |
17.360 |
|
8.321 |
92 |
19,203 |
52 |
|
| short |
7/30/07 |
8/10/09 |
742 |
|
|
|
UBS |
100 |
481 |
|
39.879 |
10.631 |
149.596 |
109.717 |
275 |
71,977 |
92 |
|
| long |
8/10/09 |
8/17/09 |
7 |
|
|
|
Credit Suisse |
100 |
2,088 |
|
34.468 |
33.629 |
|
-0.839 |
-2 |
70,224 |
-72 |
|
| short |
8/17/09 |
9/07/09 |
21 |
|
|
|
Givaudan |
100 |
147 |
|
476.190 |
502.242 |
450.139 |
-26.052 |
-5 |
66,395 |
-62 |
|
| long |
9/07/09 |
9/21/09 |
14 |
|
|
|
Swiss Re |
100 |
2,152 |
|
30.840 |
30.184 |
|
-0.656 |
-2 |
64,983 |
-43 |
|
| short |
9/21/09 |
10/12/09 |
21 |
|
|
|
Novartis |
100 |
2,359 |
|
27.537 |
28.607 |
26.466 |
-1.070 |
-4 |
62,458 |
-50 |
|
| long |
10/12/09 |
10/19/09 |
7 |
|
|
|
Swiss Re |
100 |
1,934 |
|
32.293 |
31.190 |
|
-1.103 |
-3 |
60,324 |
-84 |
|
| short |
10/19/09 |
11/09/09 |
21 |
|
|
|
Roche |
100 |
557 |
|
108.249 |
107.779 |
108.721 |
0.472 |
0 |
60,586 |
8 |
|
| long |
11/09/09 |
5/17/10 |
189 |
|
|
|
Swatch |
100 |
357 |
|
169.547 |
227.646 |
|
58.099 |
34 |
81,328 |
77 |
|
| short |
5/17/10 |
2/21/11 |
280 |
|
|
|
Actelion |
100 |
2,804 |
|
29.002 |
40.394 |
17.609 |
-11.393 |
-39 |
49,383 |
-48 |
|
| long |
2/21/11 |
2/28/11 |
7 |
|
|
|
Richemont |
100 |
1,160 |
|
42.559 |
41.624 |
|
-0.935 |
-2 |
48,299 |
-69 |
|
| short |
2/28/11 |
3/07/11 |
7 |
|
|
|
Roche |
100 |
440 |
|
109.719 |
102.126 |
117.876 |
8.157 |
7 |
51,888 |
4,107 |
|
| long |
3/07/11 |
3/14/11 |
7 |
|
|
|
Richemont |
100 |
1,227 |
|
42.288 |
39.520 |
|
-2.768 |
-7 |
48,492 |
-97 |
|
| short |
3/14/11 |
5/02/11 |
49 |
|
|
|
Roche |
100 |
479 |
|
101.160 |
110.747 |
91.573 |
-9.587 |
-9 |
43,900 |
-52 |
|
| long |
5/02/11 |
5/09/11 |
7 |
|
|
|
Richemont |
100 |
1,003 |
|
43.745 |
42.905 |
|
-0.840 |
-2 |
43,057 |
-64 |
|
| short |
5/09/11 |
5/21/12 |
378 |
|
|
|
Credit Suisse |
100 |
1,465 |
|
29.390 |
15.602 |
55.361 |
25.971 |
88 |
81,105 |
84 |
|
| long |
5/21/12 |
5/28/12 |
7 |
|
|
|
Richemont |
100 |
1,688 |
|
48.039 |
48.077 |
|
0.038 |
0 |
81,168 |
4 |
|
| short |
5/28/12 |
6/04/12 |
7 |
|
|
|
Credit Suisse |
100 |
5,158 |
|
15.734 |
15.300 |
16.181 |
0.447 |
3 |
83,472 |
330 |
|
| long |
6/04/12 |
6/11/12 |
7 |
|
|
|
Swiss Re |
100 |
1,908 |
|
43.744 |
46.079 |
|
2.335 |
5 |
87,926 |
1,405 |
|
| short |
6/11/12 |
6/18/12 |
7 |
|
|
|
Credit Suisse |
100 |
5,469 |
|
16.076 |
14.519 |
17.799 |
1.724 |
11 |
97,353 |
20,158 |
|
| long |
6/18/12 |
11/19/12 |
154 |
|
|
|
Swiss Re |
100 |
2,088 |
|
46.620 |
54.864 |
|
8.244 |
18 |
114,566 |
47 |
|
| short |
11/19/12 |
12/17/12 |
28 |
|
|
|
Julius Bär |
100 |
4,386 |
|
26.121 |
27.324 |
24.917 |
-1.203 |
-5 |
109,288 |
-46 |
|
| long |
12/17/12 |
10/14/13 |
301 |
|
|
|
Richemont |
100 |
1,823 |
|
59.929 |
74.199 |
|
14.270 |
24 |
135,302 |
30 |
|
| short |
10/14/13 |
3/31/14 |
168 |
|
|
|
Transocean |
100 |
4,102 |
|
32.983 |
29.901 |
36.381 |
3.398 |
10 |
149,242 |
24 |
|
| long |
3/31/14 |
5/05/14 |
35 |
|
|
|
Actelion |
100 |
2,171 |
|
68.719 |
71.769 |
|
3.050 |
4 |
155,863 |
57 |
|
| L/S | date buy | date sell | days | | instrument | spl | pieces | | prc buy | prc sell | ps short | prc diff | d % | asset | yield | | | short |
5/05/14 |
8/03/15 |
455 |
|
|
|
Transocean |
100 |
5,008 |
|
31.122 |
11.964 |
80.955 |
49.833 |
160 |
405,427 |
115 |
|
| long |
8/03/15 |
8/17/15 |
14 |
|
|
|
UBS |
100 |
19,212 |
|
21.102 |
20.081 |
|
-1.021 |
-5 |
385,812 |
-73 |
|
| short |
8/17/15 |
11/02/15 |
77 |
|
|
|
Transocean |
100 |
31,207 |
|
12.363 |
14.496 |
10.229 |
-2.133 |
-17 |
319,240 |
-59 |
|
| long |
11/02/15 |
11/16/15 |
14 |
|
|
|
Actelion |
100 |
2,482 |
|
128.587 |
128.360 |
|
-0.228 |
0 |
318,675 |
-5 |
|
| short |
11/16/15 |
1/09/17 |
420 |
|
|
|
Holcim |
100 |
6,309 |
|
50.510 |
49.995 |
51.029 |
0.520 |
1 |
321,953 |
1 |
|
| long |
1/09/17 |
1/23/17 |
14 |
|
|
|
Actelion |
100 |
1,517 |
|
212.189 |
215.072 |
|
2.883 |
1 |
326,327 |
42 |
|
| short |
1/23/17 |
2/20/17 |
28 |
|
|
|
Swisscom |
100 |
796 |
|
409.625 |
424.638 |
394.612 |
-15.013 |
-4 |
314,376 |
-39 |
|
| long |
2/20/17 |
3/13/17 |
21 |
|
|
|
Actelion |
100 |
1,239 |
|
253.712 |
257.548 |
|
3.836 |
2 |
319,129 |
30 |
|
| short |
3/13/17 |
3/27/17 |
14 |
|
|
|
Givaudan |
100 |
187 |
|
1,698.658 |
1,677.877 |
1,719.696 |
21.038 |
1 |
323,063 |
38 |
|
| long |
3/27/17 |
4/24/17 |
28 |
|
|
|
Actelion |
100 |
1,266 |
|
255.045 |
259.105 |
|
4.060 |
2 |
328,203 |
23 |
|
| short |
4/24/17 |
5/08/17 |
14 |
|
|
|
Swisscom |
100 |
811 |
|
404.234 |
416.139 |
392.328 |
-11.906 |
-3 |
318,548 |
-54 |
|
| long |
5/08/17 |
2/12/18 |
280 |
|
|
|
Sika |
100 |
3,182 |
|
100.107 |
108.576 |
|
8.468 |
8 |
345,494 |
11 |
|
| short |
2/12/18 |
9/09/19 |
574 |
|
|
|
Roche |
100 |
1,816 |
|
190.181 |
247.979 |
132.384 |
-57.797 |
-30 |
240,534 |
-21 |
|
| long |
9/09/19 |
2/03/20 |
147 |
|
|
|
Nestlé |
100 |
2,378 |
|
101.108 |
100.107 |
|
-1.001 |
-1 |
238,153 |
-2 |
|
| short |
2/03/20 |
2/17/20 |
14 |
|
|
|
Swatch |
100 |
1,037 |
|
229.446 |
237.871 |
221.021 |
-8.425 |
-4 |
229,417 |
-62 |
|
| long |
2/17/20 |
3/02/20 |
14 |
|
|
|
Lonza |
100 |
584 |
|
392.186 |
366.276 |
|
-25.910 |
-7 |
214,285 |
-83 |
|
| short |
3/02/20 |
12/21/20 |
294 |
|
|
|
Swatch |
100 |
1,041 |
|
205.650 |
215.380 |
195.920 |
-9.730 |
-5 |
204,156 |
-6 |
|
| long |
12/21/20 |
10/25/21 |
308 |
|
|
|
Richemont |
100 |
2,841 |
|
71.843 |
105.047 |
|
33.204 |
46 |
298,488 |
57 |
|
| short |
10/25/21 |
11/08/21 |
14 |
|
|
|
Holcim |
100 |
7,030 |
|
42.459 |
44.668 |
40.250 |
-2.209 |
-5 |
282,957 |
-75 |
|
| long |
11/08/21 |
12/13/21 |
35 |
|
|
|
Partners |
100 |
181 |
|
1,560.271 |
1,420.719 |
|
-139.552 |
-9 |
257,698 |
-62 |
|
| short |
12/13/21 |
1/03/22 |
21 |
|
|
|
Credit Suisse |
100 |
30,974 |
|
8.320 |
8.758 |
7.881 |
-0.439 |
-5 |
244,112 |
-61 |
|
| long |
1/03/22 |
1/24/22 |
21 |
|
|
|
Richemont |
100 |
1,838 |
|
132.781 |
123.610 |
|
-9.171 |
-7 |
227,255 |
-71 |
|
| short |
1/24/22 |
6/12/23 |
504 |
|
|
|
Credit Suisse |
100 |
28,401 |
|
8.002 |
0.835 |
76.679 |
68.678 |
858 |
2,177,769 |
414 |
|
| 6/12/23 |
7/10/23 |
28 |
|
- cash - |
| long |
7/10/23 |
8/14/23 |
35 |
|
|
|
Richemont |
100 |
14,723 |
|
147.913 |
135.074 |
|
-12.839 |
-9 |
1,988,745 |
-61 |
|
| short |
8/14/23 |
8/12/24 |
364 |
|
|
|
Roche |
100 |
7,196 |
|
276.358 |
286.613 |
266.102 |
-10.256 |
-4 |
1,914,944 |
-4 |
|
| accum | 1/09/06 |
8/12/24 | 7439 |
days out of 7474 invested (100%) |
19,049 |
1,914,944 |
29 |
|
Instrument Related Contribution
| instrument | L/S | date buy | date sell | days | prc buy | prc sell | ps short | prc diff | d % | | | total |
| Credit Suisse | long | 8/10/09 | 8/17/09 | 7 | 34.47 | 33.63 | | -0.84 | -2.43 | | | |
| | short | 5/09/11 | 5/21/12 | 378 | 29.39 | 15.60 | 55.36 | 25.97 | 88.37 | | | |
| | short | 5/28/12 | 6/04/12 | 7 | 15.73 | 15.30 | 16.18 | 0.45 | 2.84 | | | |
| | short | 6/11/12 | 6/18/12 | 7 | 16.08 | 14.52 | 17.80 | 1.72 | 10.72 | | | |
| | short | 12/13/21 | 1/03/22 | 21 | 8.32 | 8.76 | 7.88 | -0.44 | -5.27 | | | |
| | short | 1/24/22 | 6/12/23 | 504 | 8.00 | 0.83 | 76.68 | 68.68 | 858.30 | | | 1,799.64 |
| UBS | short | 7/30/07 | 8/10/09 | 742 | 39.88 | 10.63 | 149.60 | 109.72 | 275.13 | | | |
| | long | 8/03/15 | 8/17/15 | 14 | 21.10 | 20.08 | | -1.02 | -4.84 | | | 256.98 |
| Transocean | short | 10/14/13 | 3/31/14 | 168 | 32.98 | 29.90 | 36.38 | 3.40 | 10.30 | | | |
| | short | 5/05/14 | 8/03/15 | 455 | 31.12 | 11.96 | 80.95 | 49.83 | 160.12 | | | |
| | short | 8/17/15 | 11/02/15 | 77 | 12.36 | 14.50 | 10.23 | -2.13 | -17.26 | | | 137.42 |
| ABB | long | 1/09/06 | 7/30/07 | 567 | 9.04 | 17.36 | | 8.32 | 92.05 | | | 92.05 |
| Richemont | long | 2/21/11 | 2/28/11 | 7 | 42.56 | 41.62 | | -0.93 | -2.20 | | | |
| | long | 3/07/11 | 3/14/11 | 7 | 42.29 | 39.52 | | -2.77 | -6.55 | | | |
| | long | 5/02/11 | 5/09/11 | 7 | 43.74 | 42.90 | | -0.84 | -1.92 | | | |
| | long | 5/21/12 | 5/28/12 | 7 | 48.04 | 48.08 | | 0.04 | 0.08 | | | |
| | long | 12/17/12 | 10/14/13 | 301 | 59.93 | 74.20 | | 14.27 | 23.81 | | | |
| | long | 12/21/20 | 10/25/21 | 308 | 71.84 | 105.05 | | 33.20 | 46.22 | | | |
| | long | 1/03/22 | 1/24/22 | 21 | 132.78 | 123.61 | | -9.17 | -6.91 | | | |
| | long | 7/10/23 | 8/14/23 | 35 | 147.91 | 135.07 | | -12.84 | -8.68 | | | 38.08 |
| Swatch | long | 11/09/09 | 5/17/10 | 189 | 169.55 | 227.65 | | 58.10 | 34.27 | | | |
| | short | 2/03/20 | 2/17/20 | 14 | 229.45 | 237.87 | 221.02 | -8.43 | -3.67 | | | |
| | short | 3/02/20 | 12/21/20 | 294 | 205.65 | 215.38 | 195.92 | -9.73 | -4.73 | | | 23.22 |
| Swiss Re | long | 9/07/09 | 9/21/09 | 14 | 30.84 | 30.18 | | -0.66 | -2.13 | | | |
| | long | 10/12/09 | 10/19/09 | 7 | 32.29 | 31.19 | | -1.10 | -3.42 | | | |
| | long | 6/04/12 | 6/11/12 | 7 | 43.74 | 46.08 | | 2.33 | 5.34 | | | |
| | long | 6/18/12 | 11/19/12 | 154 | 46.62 | 54.86 | | 8.24 | 17.68 | | | 17.18 |
| instrument | L/S | date buy | date sell | days | prc buy | prc sell | ps short | prc diff | d % | | | total |
| Sika | long | 5/08/17 | 2/12/18 | 280 | 100.11 | 108.58 | | 8.47 | 8.46 | | | 8.46 |
| Nestlé | long | 9/09/19 | 2/03/20 | 147 | 101.11 | 100.11 | | -1.00 | -0.99 | | | -0.99 |
| Novartis | short | 9/21/09 | 10/12/09 | 21 | 27.54 | 28.61 | 26.47 | -1.07 | -3.89 | | | -3.89 |
| Holcim | short | 11/16/15 | 1/09/17 | 420 | 50.51 | 50.00 | 51.03 | 0.52 | 1.03 | | | |
| | short | 10/25/21 | 11/08/21 | 14 | 42.46 | 44.67 | 40.25 | -2.21 | -5.20 | | | -4.23 |
| Givaudan | short | 8/17/09 | 9/07/09 | 21 | 476.19 | 502.24 | 450.14 | -26.05 | -5.47 | | | |
| | short | 3/13/17 | 3/27/17 | 14 | 1,698.66 | 1,677.88 | 1,719.70 | 21.04 | 1.24 | | | -4.30 |
| Julius Bär | short | 11/19/12 | 12/17/12 | 28 | 26.12 | 27.32 | 24.92 | -1.20 | -4.61 | | | -4.61 |
| Swisscom | short | 1/23/17 | 2/20/17 | 28 | 409.63 | 424.64 | 394.61 | -15.01 | -3.67 | | | |
| | short | 4/24/17 | 5/08/17 | 14 | 404.23 | 416.14 | 392.33 | -11.91 | -2.95 | | | -6.50 |
| Lonza | long | 2/17/20 | 3/02/20 | 14 | 392.19 | 366.28 | | -25.91 | -6.61 | | | -6.61 |
| Partners | long | 11/08/21 | 12/13/21 | 35 | 1,560.27 | 1,420.72 | | -139.55 | -8.94 | | | -8.94 |
| Actelion | short | 5/17/10 | 2/21/11 | 280 | 29.00 | 40.39 | 17.61 | -11.39 | -39.28 | | | |
| | long | 3/31/14 | 5/05/14 | 35 | 68.72 | 71.77 | | 3.05 | 4.44 | | | |
| | long | 11/02/15 | 11/16/15 | 14 | 128.59 | 128.36 | | -0.23 | -0.18 | | | |
| | long | 1/09/17 | 1/23/17 | 14 | 212.19 | 215.07 | | 2.88 | 1.36 | | | |
| | long | 2/20/17 | 3/13/17 | 21 | 253.71 | 257.55 | | 3.84 | 1.51 | | | |
| | long | 3/27/17 | 4/24/17 | 28 | 255.04 | 259.11 | | 4.06 | 1.59 | | | -33.83 |
| Roche | short | 10/19/09 | 11/09/09 | 21 | 108.25 | 107.78 | 108.72 | 0.47 | 0.44 | | | |
| | short | 2/28/11 | 3/07/11 | 7 | 109.72 | 102.13 | 117.88 | 8.16 | 7.43 | | | |
| | short | 3/14/11 | 5/02/11 | 49 | 101.16 | 110.75 | 91.57 | -9.59 | -9.48 | | | |
| | short | 2/12/18 | 9/09/19 | 574 | 190.18 | 247.98 | 132.38 | -57.80 | -30.39 | | | |
| | short | 8/14/23 | 8/12/24 | 364 | 276.36 | 286.61 | 266.10 | -10.26 | -3.71 | | | -34.53 |
Annotations
| 6/19/18 | Sika | | | stock split 1:60 (sixty for one) |
| 5/15/17 | SMI | | | Sika replaces Syngenta (acquired by ChemChina) |
| 5/03/17 | SMI | | | Lonza replaces Actelion (acquired by Johnson & Johnson) |
| 4/05/16 | SMI | | | Transocean was replaced by Swiss Life |
| 9/10/15 | SMI | | | complete analysis |
|
|