| | |
| | |

Assessment - Automotive Suppliers in Pound sterling - 7/01/24 - RS = 51
⇐
| |
|
⇓instrument |
freshest |
⇓ Δday |
7/01/24 |
⇓ Δwk |
7/10/23 |
prc diff |
⇓ Δ51 |
|
∅-RS |
| |  |
 |
 |
|
S |
 |
SOM Auto Suppliers |
195.072 |
8/12/24 |
0.08 |
212.717 |
-8.29 |
224.730 |
-12.013 |
-5.35 |
|
-4.18 |
| | |
|
|
|
L |
|
GS Yuasa |
11.544 |
8/09/24 |
2.70 |
15.436 |
-25.21 |
15.498 |
-0.062 |
-0.40 |
|
10.65 |
| | |
|
|
|
|
|
Pirelli |
4.451 |
8/12/24 |
0.50 |
4.765 |
-6.59 |
3.827 |
0.938 |
24.51 |
|
10.72 |
| | |
|
|
|
|
|
Michelin |
29.136 |
8/12/24 |
0.41 |
30.630 |
-4.88 |
22.523 |
8.107 |
36.00 |
|
13.65 |
| | |
|
|
|
|
|
Hella |
73.223 |
8/12/24 |
0.23 |
72.884 |
0.47 |
60.904 |
11.979 |
19.67 |
|
10.18 |
| | |
|
|
|
|
|
Autoliv |
74.643 |
8/12/24 |
0.10 |
84.790 |
-11.97 |
68.556 |
16.234 |
23.68 |
|
1.84 |
| | |
|
|
|
|
|
Yokohama Rubber |
15.103 |
8/09/24 |
2.88 |
17.571 |
-14.04 |
16.796 |
0.775 |
4.61 |
|
-2.45 |
| | |
|
|
|
|
|
Bridgestone |
27.328 |
8/09/24 |
-1.33 |
30.819 |
-11.33 |
31.524 |
-0.705 |
-2.24 |
|
-6.03 |
| | |
|
|
|
|
|
Hyundai Mobis |
124.985 |
8/12/24 |
2.82 |
141.574 |
-11.72 |
139.184 |
2.389 |
1.72 |
|
2.68 |
| | |
|
|
|
S |
|
Schaeffler |
3.942 |
8/12/24 |
0.17 |
4.535 |
-13.08 |
4.653 |
-0.118 |
-2.54 |
|
-6.75 |
| | |
|
|
|
S |
|
Nokian Tyres |
6.772 |
8/12/24 |
-0.84 |
6.660 |
1.68 |
6.677 |
-0.017 |
-0.25 |
|
-5.17 |
| | |
|
|
|
S |
|
Denso |
10.325 |
8/09/24 |
-0.19 |
12.372 |
-16.54 |
13.001 |
-0.630 |
-4.85 |
|
-5.93 |
| | |
|
|
|
|
|
Xinyi Glass |
0.765 |
8/12/24 |
-0.13 |
0.867 |
-11.80 |
1.175 |
-0.308 |
-26.24 |
|
-6.83 |
| | |
|
|
|
L |
|
Cdn Tire |
85.919 |
8/12/24 |
-0.17 |
78.137 |
9.96 |
106.858 |
-28.722 |
-26.88 |
|
-8.58 |
| | |
|
|
|
S |
|
Continental |
49.941 |
8/12/24 |
0.34 |
45.003 |
10.97 |
57.859 |
-12.856 |
-22.22 |
|
-22.40 |
| | |
|
|
|
S |
|
Magna |
30.094 |
8/12/24 |
-1.88 |
33.007 |
-8.82 |
45.259 |
-12.252 |
-27.07 |
|
-22.33 |
| | |
|
|
|
S |
|
Vitesco Technologies |
44.163 |
8/12/24 |
-0.10 |
50.781 |
-13.03 |
64.283 |
-13.502 |
-21.00 |
|
-22.58 |
| | |
|
|
|
|
|
Opmobility |
7.246 |
8/12/24 |
-1.16 |
7.891 |
-8.17 |
14.371 |
-6.480 |
-45.09 |
|
-26.94 |
| | |
|
|
|
S |
|
LG Energy Solution |
187.907 |
8/12/24 |
2.02 |
198.489 |
-5.33 |
329.253 |
-130.764 |
-39.72 |
|
-22.60 |
| | |
|
|
|
|
|
Valeo |
7.976 |
8/12/24 |
-0.95 |
8.523 |
-6.42 |
16.800 |
-8.277 |
-49.27 |
|
-26.54 |
| | |
|
|
|
|
|
Forvia |
7.777 |
8/12/24 |
0.17 |
9.757 |
-20.30 |
18.913 |
-9.155 |
-48.41 |
|
-32.74 |
| Auto Suppliers - 20 out of 20 instruments rated - 7/01/24 / 7/10/23 - 6 did rise, Market-Ratio(51) in GBP = 30.00 % |
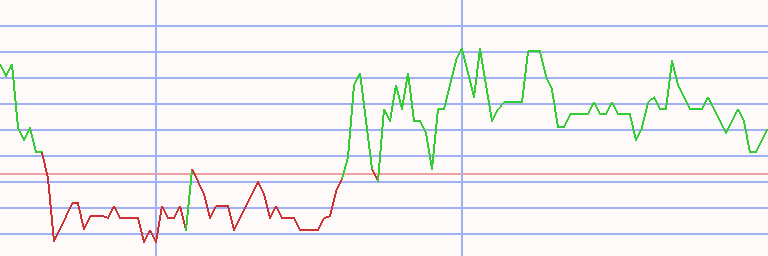
Technical Chart
Transactions Automotive Suppliers in Pound sterling * S51 - 32 ex 8 (1)
|
⇐ |
| |
| L/S | date buy | date sell | days | | instrument | spl | pieces | | prc buy | prc sell | ps short | prc diff | d % | asset | yield | |
| 1/02/06 |
1/07/08 |
735 |
|
- cash - |
| short |
1/07/08 |
8/11/08 |
217 |
|
|
|
Valeo |
100 |
1,616 |
|
6.184 |
6.398 |
5.971 |
-0.214 |
-3 |
9,655 |
-6 |
|
| |
8/11/08 |
2/09/09 |
182 |
|
|
|
Xinyi Glass |
100 |
74,839 |
|
0.129 |
0.107 |
0.155 |
0.026 |
20 |
11,585 |
44 |
|
| |
2/09/09 |
7/27/09 |
168 |
|
|
|
Continental |
100 |
1,060 |
|
10.926 |
17.889 |
3.963 |
-6.963 |
-64 |
4,205 |
-89 |
|
| 7/27/09 |
8/31/09 |
35 |
|
- cash - |
| |
8/31/09 |
9/07/09 |
7 |
|
|
|
Forvia |
100 |
497 |
|
8.445 |
8.564 |
8.325 |
-0.119 |
-1 |
4,145 |
-52 |
|
| 9/07/09 |
9/26/11 |
749 |
|
- cash - |
| |
9/26/11 |
10/10/11 |
14 |
|
|
|
Xinyi Glass |
100 |
18,980 |
|
0.218 |
0.296 |
0.141 |
-0.077 |
-35 |
2,674 |
-100 |
|
| 10/10/11 |
11/14/11 |
35 |
|
- cash - |
| |
11/14/11 |
1/16/12 |
63 |
|
|
|
Forvia |
100 |
178 |
|
14.946 |
14.317 |
15.602 |
0.656 |
4 |
2,791 |
28 |
|
| 1/16/12 |
4/23/12 |
98 |
|
- cash - |
| |
4/23/12 |
4/30/12 |
7 |
|
|
|
Forvia |
100 |
213 |
|
13.066 |
13.234 |
12.898 |
-0.168 |
-1 |
2,755 |
-49 |
|
| 4/30/12 |
5/07/12 |
7 |
|
- cash - |
| |
5/07/12 |
7/30/12 |
84 |
|
|
|
Forvia |
100 |
215 |
|
12.772 |
10.405 |
15.678 |
2.906 |
23 |
3,380 |
144 |
|
| 7/30/12 |
1/18/16 |
1267 |
|
- cash - |
| |
1/18/16 |
6/06/16 |
140 |
|
|
|
Yokohama Rubber |
100 |
34,183 |
|
0.099 |
0.103 |
0.095 |
-0.004 |
-4 |
3,251 |
-10 |
|
| 6/06/16 |
6/13/16 |
7 |
|
- cash - |
| |
6/13/16 |
6/20/16 |
7 |
|
|
|
Yokohama Rubber |
100 |
33,419 |
|
0.097 |
0.089 |
0.106 |
0.009 |
9 |
3,556 |
10,638 |
|
| 6/20/16 |
6/27/16 |
7 |
|
- cash - |
| |
6/27/16 |
7/18/16 |
21 |
|
|
|
Yokohama Rubber |
100 |
39,065 |
|
0.091 |
0.099 |
0.084 |
-0.008 |
-8 |
3,262 |
-78 |
|
| 7/18/16 |
9/17/18 |
791 |
|
- cash - |
| |
9/17/18 |
9/24/18 |
7 |
|
|
|
Valeo |
100 |
97 |
|
33.448 |
35.884 |
31.013 |
-2.435 |
-7 |
3,026 |
-98 |
|
| 9/24/18 |
10/08/18 |
14 |
|
- cash - |
| |
10/08/18 |
4/29/19 |
203 |
|
|
|
Valeo |
100 |
107 |
|
28.121 |
28.617 |
27.624 |
-0.497 |
-2 |
2,973 |
-3 |
|
| |
4/29/19 |
9/16/19 |
140 |
|
|
|
Schaeffler |
100 |
451 |
|
6.583 |
7.029 |
6.136 |
-0.447 |
-7 |
2,771 |
-17 |
|
| |
9/16/19 |
10/14/19 |
28 |
|
|
|
GS Yuasa |
100 |
19,565 |
|
0.142 |
0.136 |
0.148 |
0.006 |
4 |
2,894 |
76 |
|
| 10/14/19 |
2/24/20 |
133 |
|
- cash - |
| |
2/24/20 |
3/23/20 |
28 |
|
|
|
Pirelli |
100 |
772 |
|
3.746 |
3.229 |
4.346 |
0.599 |
16 |
3,356 |
593 |
|
| |
3/23/20 |
6/08/20 |
77 |
|
|
|
Continental |
100 |
74 |
|
44.966 |
72.282 |
17.650 |
-27.316 |
-61 |
1,335 |
-99 |
|
| 6/08/20 |
6/15/20 |
7 |
|
- cash - |
| |
6/15/20 |
8/17/20 |
63 |
|
|
|
Yokohama Rubber |
100 |
11,827 |
|
0.113 |
0.117 |
0.109 |
-0.004 |
-3 |
1,292 |
-17 |
|
| 8/17/20 |
8/24/20 |
7 |
|
- cash - |
| |
8/24/20 |
11/23/20 |
91 |
|
|
|
Schaeffler |
100 |
253 |
|
5.097 |
5.502 |
4.693 |
-0.405 |
-8 |
1,189 |
-28 |
|
| 11/23/20 |
2/28/22 |
462 |
|
- cash - |
| |
2/28/22 |
8/15/22 |
168 |
|
|
|
Nokian Tyres |
100 |
83 |
|
14.224 |
9.199 |
21.994 |
7.770 |
55 |
1,834 |
158 |
|
| 8/15/22 |
8/22/22 |
7 |
|
- cash - |
| |
8/22/22 |
2/06/23 |
168 |
|
|
|
Forvia |
100 |
148 |
|
12.358 |
16.788 |
7.927 |
-4.431 |
-36 |
1,178 |
-62 |
|
| |
2/06/23 |
2/13/23 |
7 |
|
|
|
Nokian Tyres |
100 |
116 |
|
10.100 |
8.441 |
12.085 |
1.985 |
20 |
1,409 |
> 999,999 |
|
| 2/13/23 |
6/29/26 |
1232 |
|
- cash - |
| accum | 1/07/08 |
2/13/23 | 1890 |
days out of 7483 invested (25%) |
-86 |
1,409 |
-32 |
|
Instrument Related Contribution
| instrument | L/S | date buy | date sell | days | prc buy | prc sell | ps short | prc diff | d % | | | total |
| Nokian Tyres | short | 2/28/22 | 8/15/22 | 168 | 14.22 | 9.20 | 21.99 | 7.77 | 54.62 | | | |
| | | 2/06/23 | 2/13/23 | 7 | 10.10 | 8.44 | 12.08 | 1.99 | 19.66 | | | 85.02 |
| Pirelli | | 2/24/20 | 3/23/20 | 28 | 3.75 | 3.23 | 4.35 | 0.60 | 16.00 | | | 16.00 |
| GS Yuasa | | 9/16/19 | 10/14/19 | 28 | 0.14 | 0.14 | 0.15 | 0.01 | 4.42 | | | 4.42 |
| Yokohama Rubber | | 1/18/16 | 6/06/16 | 140 | 0.10 | 0.10 | 0.10 | -0.00 | -3.83 | | | |
| | | 6/13/16 | 6/20/16 | 7 | 0.10 | 0.09 | 0.11 | 0.01 | 9.38 | | | |
| | | 6/27/16 | 7/18/16 | 21 | 0.09 | 0.10 | 0.08 | -0.01 | -8.26 | | | |
| | | 6/15/20 | 8/17/20 | 63 | 0.11 | 0.12 | 0.11 | -0.00 | -3.26 | | | -6.64 |
| Valeo | | 1/07/08 | 8/11/08 | 217 | 6.18 | 6.40 | 5.97 | -0.21 | -3.46 | | | |
| | | 9/17/18 | 9/24/18 | 7 | 33.45 | 35.88 | 31.01 | -2.44 | -7.28 | | | |
| | | 10/08/18 | 4/29/19 | 203 | 28.12 | 28.62 | 27.62 | -0.50 | -1.77 | | | -12.07 |
| Schaeffler | | 4/29/19 | 9/16/19 | 140 | 6.58 | 7.03 | 6.14 | -0.45 | -6.79 | | | |
| | | 8/24/20 | 11/23/20 | 91 | 5.10 | 5.50 | 4.69 | -0.40 | -7.94 | | | -14.19 |
| Forvia | | 8/31/09 | 9/07/09 | 7 | 8.44 | 8.56 | 8.33 | -0.12 | -1.41 | | | |
| | | 11/14/11 | 1/16/12 | 63 | 14.95 | 14.32 | 15.60 | 0.66 | 4.39 | | | |
| | | 4/23/12 | 4/30/12 | 7 | 13.07 | 13.23 | 12.90 | -0.17 | -1.29 | | | |
| | | 5/07/12 | 7/30/12 | 84 | 12.77 | 10.40 | 15.68 | 2.91 | 22.75 | | | |
| | | 8/22/22 | 2/06/23 | 168 | 12.36 | 16.79 | 7.93 | -4.43 | -35.85 | | | -20.01 |
| Xinyi Glass | | 8/11/08 | 2/09/09 | 182 | 0.13 | 0.11 | 0.15 | 0.03 | 20.00 | | | |
| | | 9/26/11 | 10/10/11 | 14 | 0.22 | 0.30 | 0.14 | -0.08 | -35.48 | | | -22.58 |
| Continental | | 2/09/09 | 7/27/09 | 168 | 10.93 | 17.89 | 3.96 | -6.96 | -63.73 | | | |
| | | 3/23/20 | 6/08/20 | 77 | 44.97 | 72.28 | 17.65 | -27.32 | -60.75 | | | -85.76 |
Annotations
| 9/28/23 | Denso | | | stock split 1:4 (four for one) |
| 6/16/22 | Michelin | | | stock split 1:4 (four for one) |
| 4/04/22 | Hella | | | acquired by Faurecia |
| 9/16/21 | Continental | | | spin-off drive technology: one additional Vitesco for five Continental |
| 6/29/18 | Autoliv | | | spin-off of Veoneer |
| 6/22/18 | Pirelli | | | returns |
| 2/10/17 | Auto Suppliers | | | machine learning processed for all techniques |
| 6/06/16 | Valeo | | | stock split 1:3 (three for one) |
| 6/04/16 | Schaeffler | | | moves from SDAX to MDAX (2016-06-20) |
| 12/21/15 | Schaeffler | | | entry (SDAX) |
| 11/02/15 | Pirelli | | | drops out due to acquisition by CNCC |
| 3/13/15 | Auto Suppliers | | | first full analysis, Best Long and Short do not cooperate, so the Alternating seems to be the best way. |
| 1/19/15 | Hella | | | entry |
|