| | Sat, 20th Jun 2026, 19:12UTC |
| | |

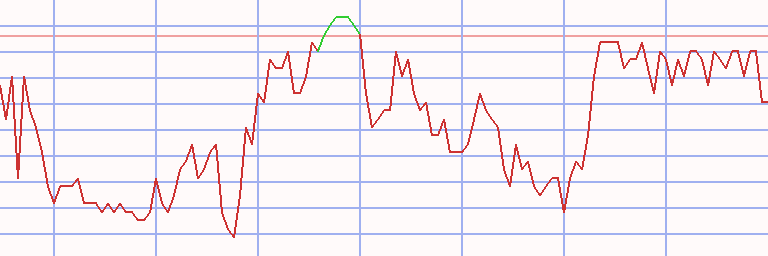
Assessment - OMX Stockholm 30 in Pound sterling - 1/07/24 - RS = 17
⇐
| |
|
⇓instrument |
freshest |
⇓ Δday |
1/07/24 |
⇓ Δwk |
4/03/24 |
prc diff |
⇓ Δ17 |
|
∅-RS |
| |  |
 |
 |
|
|
 |
OMXS30 |
183.066 |
12/08/24 |
0.09 |
192.285 |
-4.79 |
186.771 |
5.514 |
2.95 |
|
10.71 |
| | |
|
|
|
L |
|
SBB |
0.463 |
12/08/24 |
-2.81 |
0.433 |
6.87 |
0.259 |
0.174 |
67.18 |
|
43.24 |
| | |
|
|
|
L |
|
ABB |
41.138 |
12/08/24 |
0.47 |
44.084 |
-6.68 |
36.307 |
7.777 |
21.42 |
|
32.52 |
| | |
|
|
|
L |
|
Atlas Copco A |
13.178 |
12/08/24 |
0.28 |
14.789 |
-10.89 |
13.692 |
1.097 |
8.01 |
|
20.46 |
| | |
|
|
|
L |
|
Investor |
21.276 |
12/08/24 |
0.30 |
21.577 |
-1.40 |
19.743 |
1.834 |
9.29 |
|
23.97 |
| | |
|
|
|
L |
|
Atlas Copco B |
11.564 |
12/08/24 |
|
12.717 |
-9.07 |
11.817 |
0.900 |
7.62 |
|
19.48 |
| | |
|
|
|
L |
|
Tele2 |
8.172 |
12/08/24 |
0.69 |
7.930 |
3.05 |
6.522 |
1.408 |
21.59 |
|
22.65 |
| | |
|
|
|
L |
|
Alfa Laval |
33.290 |
12/08/24 |
0.61 |
34.956 |
-4.77 |
30.237 |
4.719 |
15.61 |
|
18.17 |
| | |
|
|
|
L |
|
Hennes & Mauritz |
11.739 |
12/08/24 |
-0.22 |
12.457 |
-5.76 |
10.522 |
1.935 |
18.39 |
|
1.74 |
| | |
|
|
|
L |
|
AstraZeneca |
128.248 |
12/08/24 |
0.88 |
123.450 |
3.89 |
101.473 |
21.977 |
21.66 |
|
14.09 |
| | |
|
|
|
|
|
S.E.B |
11.211 |
12/08/24 |
-0.10 |
11.739 |
-4.50 |
11.653 |
0.085 |
0.73 |
|
15.38 |
| | |
|
|
|
|
|
Assa Abloy |
22.756 |
12/08/24 |
0.13 |
22.339 |
1.86 |
22.440 |
-0.100 |
-0.45 |
|
10.34 |
| | |
|
|
|
|
|
Boliden |
22.689 |
12/08/24 |
1.33 |
25.293 |
-10.29 |
20.116 |
5.177 |
25.73 |
|
11.70 |
| | |
|
|
|
L |
|
Ericsson |
5.288 |
12/08/24 |
1.14 |
4.992 |
5.93 |
4.302 |
0.689 |
16.02 |
|
18.68 |
| | |
|
|
|
L |
|
Telia Company |
2.299 |
12/08/24 |
0.19 |
2.148 |
7.07 |
1.850 |
0.298 |
16.09 |
|
16.74 |
| | |
|
|
|
|
|
Volvo |
19.022 |
12/08/24 |
-0.12 |
20.338 |
-6.47 |
22.018 |
-1.679 |
-7.63 |
|
9.65 |
| | |
|
|
|
L |
|
Essity B |
22.101 |
12/08/24 |
-0.97 |
20.524 |
7.68 |
18.385 |
2.139 |
11.63 |
|
7.47 |
| | |
|
|
|
|
|
Autoliv |
74.643 |
12/08/24 |
0.10 |
84.790 |
-11.97 |
92.345 |
-7.555 |
-8.18 |
|
1.84 |
| | |
|
|
|
|
|
SKF B |
13.866 |
12/08/24 |
|
15.927 |
-12.94 |
17.153 |
-1.226 |
-7.15 |
|
6.46 |
| | |
|
|
|
|
|
Swedbank |
15.406 |
12/08/24 |
-0.86 |
16.559 |
-6.96 |
17.434 |
-0.875 |
-5.02 |
|
9.37 |
| | |
|
|
|
|
|
Nordea Bank |
8.912 |
12/08/24 |
-0.13 |
9.682 |
-7.95 |
9.668 |
0.014 |
0.14 |
|
5.91 |
| | |
|
|
|
|
|
Hexagon |
7.491 |
12/08/24 |
-0.15 |
8.957 |
-16.36 |
9.250 |
-0.293 |
-3.17 |
|
8.42 |
| | |
|
|
|
|
|
Svenska Cellulosa B |
10.195 |
12/08/24 |
0.81 |
11.609 |
-12.18 |
10.965 |
0.644 |
5.87 |
|
4.19 |
| | |
|
|
|
|
|
Sandvik |
15.071 |
12/08/24 |
-0.54 |
15.994 |
-5.77 |
17.663 |
-1.669 |
-9.45 |
|
0.18 |
| | |
|
|
|
S |
|
Svenska Handelsbank |
7.599 |
12/08/24 |
0.29 |
7.573 |
0.34 |
9.505 |
-1.932 |
-20.32 |
|
0.12 |
| |
|
⇓instrument |
freshest |
⇓ Δday |
1/07/24 |
⇓ Δwk |
4/03/24 |
prc diff |
⇓ Δ17 |
|
∅-RS |
| | |
|
|
|
S |
|
Sinch |
1.930 |
12/08/24 |
-2.15 |
1.982 |
-2.59 |
1.978 |
0.004 |
0.20 |
|
7.11 |
| | |
|
|
|
L |
|
Electrolux |
6.384 |
12/08/24 |
-0.26 |
6.511 |
-1.94 |
6.697 |
-0.186 |
-2.78 |
|
-16.59 |
| | |
|
|
|
S |
|
Evolution |
74.211 |
12/08/24 |
-0.88 |
82.238 |
-9.76 |
101.534 |
-19.296 |
-19.00 |
|
-8.02 |
| | |
|
|
|
S |
|
Getinge |
14.733 |
12/08/24 |
-0.10 |
13.498 |
9.15 |
15.480 |
-1.982 |
-12.80 |
|
-11.08 |
| | |
|
|
|
|
|
Kinnevik |
5.909 |
12/08/24 |
-0.36 |
6.606 |
-10.55 |
7.888 |
-1.282 |
-16.26 |
|
-21.52 |
| | |
|
|
|
|
|
NIBE Industrier |
3.316 |
12/08/24 |
0.18 |
3.359 |
-1.26 |
4.401 |
-1.043 |
-23.69 |
|
-30.42 |
| OMXS 30 - 30 out of 30 instruments rated - 1/07/24 / 4/03/24 - 17 did rise, Market-Ratio(17) in GBP = 56.67 % |
| Stock Exchange Currency: SEK kr Swedish krona |
Technical Chart
Transactions OMX Stockholm 30 in Pound sterling * L17 - 86 ex 1 (1)
|
⇐ |
| |
| L/S | date buy | date sell | days | | instrument | spl | pieces | | prc buy | prc sell | | prc diff | d % | asset | yield | | | long |
2/01/06 |
8/05/06 |
126 |
|
|
|
Boliden |
100 |
2,073 |
|
4.823 |
12.382 |
|
7.559 |
157 |
25,669 |
1,435 |
|
| 8/05/06 |
2/10/06 |
147 |
|
- cash - |
| |
2/10/06 |
27/11/06 |
56 |
|
|
|
Boliden |
100 |
2,540 |
|
10.106 |
12.326 |
|
2.220 |
22 |
31,308 |
265 |
|
| 27/11/06 |
4/12/06 |
7 |
|
- cash - |
| |
4/12/06 |
18/12/06 |
14 |
|
|
|
Boliden |
100 |
2,484 |
|
12.601 |
12.685 |
|
0.084 |
1 |
31,517 |
19 |
|
| |
18/12/06 |
12/02/07 |
56 |
|
|
|
NIBE Industrier |
100 |
64,993 |
|
0.485 |
0.515 |
|
0.030 |
6 |
33,482 |
48 |
|
| 12/02/07 |
26/02/07 |
14 |
|
- cash - |
| |
26/02/07 |
5/03/07 |
7 |
|
|
|
NIBE Industrier |
100 |
62,841 |
|
0.533 |
0.479 |
|
-0.054 |
-10 |
30,100 |
-100 |
|
| 5/03/07 |
26/03/07 |
21 |
|
- cash - |
| |
26/03/07 |
2/04/07 |
7 |
|
|
|
Electrolux |
100 |
2,336 |
|
12.885 |
12.588 |
|
-0.297 |
-2 |
29,406 |
-70 |
|
| 2/04/07 |
9/04/07 |
7 |
|
- cash - |
| |
9/04/07 |
23/04/07 |
14 |
|
|
|
Electrolux |
100 |
2,163 |
|
13.594 |
12.996 |
|
-0.598 |
-4 |
28,112 |
-69 |
|
| 23/04/07 |
4/05/09 |
742 |
|
- cash - |
| |
4/05/09 |
1/06/09 |
28 |
|
|
|
Boliden |
100 |
5,505 |
|
5.106 |
4.885 |
|
-0.221 |
-4 |
26,895 |
-44 |
|
| 1/06/09 |
15/06/09 |
14 |
|
- cash - |
| |
15/06/09 |
5/10/09 |
112 |
|
|
|
Boliden |
100 |
5,691 |
|
4.726 |
6.998 |
|
2.272 |
48 |
39,824 |
259 |
|
| 5/10/09 |
12/10/09 |
7 |
|
- cash - |
| |
12/10/09 |
16/11/09 |
35 |
|
|
|
Boliden |
100 |
5,072 |
|
7.851 |
8.120 |
|
0.269 |
3 |
41,186 |
42 |
|
| 16/11/09 |
25/01/10 |
70 |
|
- cash - |
| |
25/01/10 |
1/02/10 |
7 |
|
|
|
Boliden |
100 |
4,804 |
|
8.572 |
8.149 |
|
-0.423 |
-5 |
39,156 |
-93 |
|
| 1/02/10 |
22/03/10 |
49 |
|
- cash - |
| |
22/03/10 |
29/03/10 |
7 |
|
|
|
Autoliv |
100 |
1,501 |
|
26.075 |
26.217 |
|
0.143 |
1 |
39,370 |
33 |
|
| 29/03/10 |
5/04/10 |
7 |
|
- cash - |
| |
5/04/10 |
3/05/10 |
28 |
|
|
|
Autoliv |
100 |
1,526 |
|
25.789 |
27.452 |
|
1.663 |
6 |
41,908 |
126 |
|
| 3/05/10 |
14/06/10 |
42 |
|
- cash - |
| |
14/06/10 |
21/06/10 |
7 |
|
|
|
Volvo |
100 |
5,192 |
|
8.071 |
7.909 |
|
-0.162 |
-2 |
41,069 |
-65 |
|
| 21/06/10 |
13/09/10 |
84 |
|
- cash - |
| |
13/09/10 |
20/09/10 |
7 |
|
|
|
Autoliv |
100 |
1,416 |
|
28.992 |
29.402 |
|
0.410 |
1 |
41,650 |
108 |
|
| |
20/09/10 |
4/10/10 |
14 |
|
|
|
Hexagon |
100 |
26,147 |
|
1.593 |
1.695 |
|
0.102 |
6 |
44,323 |
406 |
|
| 4/10/10 |
8/11/10 |
35 |
|
- cash - |
| |
8/11/10 |
15/11/10 |
7 |
|
|
|
Autoliv |
100 |
1,267 |
|
34.963 |
34.535 |
|
-0.428 |
-1 |
43,781 |
-47 |
|
| 15/11/10 |
13/12/10 |
28 |
|
- cash - |
| |
13/12/10 |
27/12/10 |
14 |
|
|
|
Atlas Copco A |
100 |
14,728 |
|
2.973 |
3.053 |
|
0.080 |
3 |
44,963 |
100 |
|
| |
27/12/10 |
3/01/11 |
7 |
|
|
|
Volvo |
100 |
4,012 |
|
11.207 |
11.469 |
|
0.262 |
2 |
46,014 |
234 |
|
| 3/01/11 |
19/12/11 |
350 |
|
- cash - |
| |
19/12/11 |
26/12/11 |
7 |
|
|
|
Getinge |
100 |
2,911 |
|
15.802 |
16.267 |
|
0.465 |
3 |
47,368 |
354 |
|
| 26/12/11 |
2/01/12 |
7 |
|
- cash - |
| |
2/01/12 |
9/01/12 |
7 |
|
|
|
Getinge |
100 |
2,856 |
|
16.580 |
16.052 |
|
-0.528 |
-3 |
45,859 |
-82 |
|
| |
9/01/12 |
16/01/12 |
7 |
|
|
|
Svenska Cellulosa B |
100 |
22,991 |
|
1.995 |
1.980 |
|
-0.015 |
-1 |
45,521 |
-32 |
|
| |
16/01/12 |
23/01/12 |
7 |
|
|
|
Boliden |
100 |
4,146 |
|
10.978 |
11.186 |
|
0.209 |
2 |
46,385 |
167 |
|
| |
23/01/12 |
30/01/12 |
7 |
|
|
|
Svenska Cellulosa B |
100 |
21,245 |
|
2.183 |
2.185 |
|
0.001 |
0 |
46,417 |
4 |
|
| |
30/01/12 |
13/02/12 |
14 |
|
|
|
Essity B |
100 |
5,443 |
|
8.527 |
8.653 |
|
0.126 |
1 |
47,104 |
47 |
|
| L/S | date buy | date sell | days | | instrument | spl | pieces | | prc buy | prc sell | | prc diff | d % | asset | yield | | | |
13/02/12 |
27/02/12 |
14 |
|
|
|
Assa Abloy |
100 |
7,435 |
|
6.335 |
6.356 |
|
0.021 |
0 |
47,258 |
9 |
|
| |
27/02/12 |
5/03/12 |
7 |
|
|
|
Svenska Cellulosa B |
100 |
20,845 |
|
2.267 |
2.306 |
|
0.039 |
2 |
48,078 |
145 |
|
| |
5/03/12 |
12/03/12 |
7 |
|
|
|
Essity B |
100 |
5,340 |
|
9.003 |
8.952 |
|
-0.052 |
-1 |
47,803 |
-26 |
|
| |
12/03/12 |
19/03/12 |
7 |
|
|
|
Svenska Cellulosa B |
100 |
20,836 |
|
2.294 |
2.279 |
|
-0.015 |
-1 |
47,494 |
-29 |
|
| |
19/03/12 |
26/03/12 |
7 |
|
|
|
Essity B |
100 |
5,337 |
|
8.897 |
8.954 |
|
0.056 |
1 |
47,794 |
39 |
|
| |
26/03/12 |
2/04/12 |
7 |
|
|
|
Svenska Cellulosa B |
100 |
20,829 |
|
2.295 |
2.231 |
|
-0.064 |
-3 |
46,461 |
-77 |
|
| 2/04/12 |
9/04/12 |
7 |
|
- cash - |
| |
9/04/12 |
23/04/12 |
14 |
|
|
|
Assa Abloy |
100 |
7,617 |
|
6.100 |
6.099 |
|
-0.001 |
0 |
46,457 |
0 |
|
| 23/04/12 |
10/09/12 |
140 |
|
- cash - |
| |
10/09/12 |
17/09/12 |
7 |
|
|
|
Electrolux |
100 |
2,791 |
|
16.645 |
15.554 |
|
-1.091 |
-7 |
43,412 |
-97 |
|
| |
17/09/12 |
24/09/12 |
7 |
|
|
|
S.E.B |
100 |
7,979 |
|
5.440 |
5.431 |
|
-0.009 |
0 |
43,339 |
-8 |
|
| 24/09/12 |
1/10/12 |
7 |
|
- cash - |
| |
1/10/12 |
22/10/12 |
21 |
|
|
|
S.E.B |
100 |
8,018 |
|
5.405 |
5.245 |
|
-0.160 |
-3 |
42,054 |
-41 |
|
| 22/10/12 |
12/08/13 |
294 |
|
- cash - |
| |
12/08/13 |
19/08/13 |
7 |
|
|
|
Kinnevik |
100 |
2,120 |
|
19.831 |
20.299 |
|
0.467 |
2 |
43,045 |
237 |
|
| 19/08/13 |
21/10/13 |
63 |
|
- cash - |
| |
21/10/13 |
4/11/13 |
14 |
|
|
|
Kinnevik |
100 |
1,840 |
|
23.391 |
23.282 |
|
-0.110 |
0 |
42,843 |
-12 |
|
| 4/11/13 |
24/02/14 |
112 |
|
- cash - |
| |
24/02/14 |
3/03/14 |
7 |
|
|
|
NIBE Industrier |
100 |
45,060 |
|
0.951 |
0.912 |
|
-0.039 |
-4 |
41,082 |
-89 |
|
| 3/03/14 |
2/06/14 |
91 |
|
- cash - |
| |
2/06/14 |
9/06/14 |
7 |
|
|
|
NIBE Industrier |
100 |
39,178 |
|
1.049 |
1.047 |
|
-0.002 |
0 |
41,005 |
-9 |
|
| 9/06/14 |
26/01/15 |
231 |
|
- cash - |
| |
26/01/15 |
2/03/15 |
35 |
|
|
|
Electrolux |
100 |
2,299 |
|
17.828 |
20.954 |
|
3.126 |
18 |
48,191 |
439 |
|
| |
2/03/15 |
25/05/15 |
84 |
|
|
|
Boliden |
100 |
3,696 |
|
13.038 |
13.893 |
|
0.856 |
7 |
51,353 |
32 |
|
| 25/05/15 |
10/10/16 |
504 |
|
- cash - |
| |
10/10/16 |
17/10/16 |
7 |
|
|
|
Boliden |
100 |
2,608 |
|
19.685 |
19.157 |
|
-0.528 |
-3 |
49,975 |
-76 |
|
| 17/10/16 |
24/10/16 |
7 |
|
- cash - |
| |
24/10/16 |
31/10/16 |
7 |
|
|
|
Boliden |
100 |
2,608 |
|
19.157 |
18.954 |
|
-0.203 |
-1 |
49,446 |
-43 |
|
| 31/10/16 |
27/02/17 |
119 |
|
- cash - |
| |
27/02/17 |
10/04/17 |
42 |
|
|
|
Sinch |
100 |
50,219 |
|
0.985 |
0.983 |
|
-0.001 |
0 |
49,378 |
-1 |
|
| 10/04/17 |
15/05/17 |
35 |
|
- cash - |
| |
15/05/17 |
22/05/17 |
7 |
|
|
|
Sinch |
100 |
43,939 |
|
1.124 |
1.095 |
|
-0.029 |
-3 |
48,094 |
-75 |
|
| 22/05/17 |
8/04/19 |
686 |
|
- cash - |
| |
8/04/19 |
15/04/19 |
7 |
|
|
|
NIBE Industrier |
100 |
18,672 |
|
2.576 |
2.574 |
|
-0.002 |
0 |
48,054 |
-4 |
|
| |
15/04/19 |
29/04/19 |
14 |
|
|
|
Sinch |
100 |
49,366 |
|
0.973 |
0.979 |
|
0.005 |
1 |
48,305 |
15 |
|
| |
29/04/19 |
20/05/19 |
21 |
|
|
|
Evolution |
100 |
3,144 |
|
15.360 |
14.645 |
|
-0.715 |
-5 |
46,057 |
-56 |
|
| 20/05/19 |
30/09/19 |
133 |
|
- cash - |
| |
30/09/19 |
7/10/19 |
7 |
|
|
|
SBB |
100 |
26,412 |
|
1.744 |
1.623 |
|
-0.121 |
-7 |
42,856 |
-98 |
|
| 7/10/19 |
18/11/19 |
42 |
|
- cash - |
| |
18/11/19 |
25/11/19 |
7 |
|
|
|
Sinch |
100 |
24,808 |
|
1.727 |
1.764 |
|
0.036 |
2 |
43,755 |
195 |
|
| L/S | date buy | date sell | days | | instrument | spl | pieces | | prc buy | prc sell | | prc diff | d % | asset | yield | | | |
25/11/19 |
2/12/19 |
7 |
|
|
|
SBB |
100 |
22,976 |
|
1.904 |
1.916 |
|
0.012 |
1 |
44,024 |
38 |
|
| |
2/12/19 |
13/01/20 |
42 |
|
|
|
Sinch |
100 |
23,371 |
|
1.884 |
2.613 |
|
0.729 |
39 |
61,067 |
1,618 |
|
| 13/01/20 |
13/07/20 |
182 |
|
- cash - |
| |
13/07/20 |
7/09/20 |
56 |
|
|
|
Sinch |
100 |
8,879 |
|
6.878 |
6.800 |
|
-0.077 |
-1 |
60,381 |
-7 |
|
| 7/09/20 |
14/09/20 |
7 |
|
- cash - |
| |
14/09/20 |
5/10/20 |
21 |
|
|
|
Sinch |
100 |
8,819 |
|
6.846 |
7.563 |
|
0.717 |
10 |
66,706 |
465 |
|
| 5/10/20 |
12/10/20 |
7 |
|
- cash - |
| |
12/10/20 |
26/10/20 |
14 |
|
|
|
Sinch |
100 |
8,438 |
|
7.905 |
7.021 |
|
-0.884 |
-11 |
59,244 |
-95 |
|
| 26/10/20 |
30/11/20 |
35 |
|
- cash - |
| |
30/11/20 |
14/12/20 |
14 |
|
|
|
Sinch |
100 |
6,015 |
|
9.849 |
10.769 |
|
0.919 |
9 |
64,774 |
924 |
|
| 14/12/20 |
18/01/21 |
35 |
|
- cash - |
| |
18/01/21 |
1/02/21 |
14 |
|
|
|
Sinch |
100 |
6,052 |
|
10.702 |
11.094 |
|
0.392 |
4 |
67,145 |
155 |
|
| 1/02/21 |
1/03/21 |
28 |
|
- cash - |
| |
1/03/21 |
8/03/21 |
7 |
|
|
|
Sinch |
100 |
4,890 |
|
13.729 |
11.837 |
|
-1.892 |
-14 |
57,893 |
-100 |
|
| 8/03/21 |
15/03/21 |
7 |
|
- cash - |
| |
15/03/21 |
29/03/21 |
14 |
|
|
|
Sinch |
100 |
4,719 |
|
12.266 |
12.541 |
|
0.275 |
2 |
59,189 |
78 |
|
| 29/03/21 |
5/04/21 |
7 |
|
- cash - |
| |
5/04/21 |
31/05/21 |
56 |
|
|
|
Evolution |
100 |
545 |
|
108.449 |
134.744 |
|
26.295 |
24 |
73,520 |
312 |
|
| 31/05/21 |
7/06/21 |
7 |
|
- cash - |
| |
7/06/21 |
21/06/21 |
14 |
|
|
|
Evolution |
100 |
551 |
|
133.263 |
122.933 |
|
-10.331 |
-8 |
67,828 |
-88 |
|
| 21/06/21 |
16/01/23 |
574 |
|
- cash - |
| |
16/01/23 |
20/02/23 |
35 |
|
|
|
Sinch |
100 |
16,419 |
|
4.131 |
3.087 |
|
-1.044 |
-25 |
50,688 |
-95 |
|
| |
20/02/23 |
13/03/23 |
21 |
|
|
|
Swedbank |
100 |
3,005 |
|
16.868 |
14.953 |
|
-1.915 |
-11 |
44,935 |
-88 |
|
| 13/03/23 |
20/06/26 |
1195 |
|
- cash - |
| accum | 2/01/06 |
13/03/23 | 1288 |
days out of 7474 invested (17%) |
349 |
44,935 |
53 |
|
Instrument Related Contribution
| instrument | L/S | date buy | date sell | days | prc buy | prc sell | | prc diff | d % | | | total |
| Boliden | long | 2/01/06 | 8/05/06 | 126 | 4.82 | 12.38 | | 7.56 | 156.72 | | | |
| | | 2/10/06 | 27/11/06 | 56 | 10.11 | 12.33 | | 2.22 | 21.97 | | | |
| | | 4/12/06 | 18/12/06 | 14 | 12.60 | 12.68 | | 0.08 | 0.67 | | | |
| | | 4/05/09 | 1/06/09 | 28 | 5.11 | 4.89 | | -0.22 | -4.33 | | | |
| | | 15/06/09 | 5/10/09 | 112 | 4.73 | 7.00 | | 2.27 | 48.07 | | | |
| | | 12/10/09 | 16/11/09 | 35 | 7.85 | 8.12 | | 0.27 | 3.42 | | | |
| | | 25/01/10 | 1/02/10 | 7 | 8.57 | 8.15 | | -0.42 | -4.93 | | | |
| | | 16/01/12 | 23/01/12 | 7 | 10.98 | 11.19 | | 0.21 | 1.90 | | | |
| | | 2/03/15 | 25/05/15 | 84 | 13.04 | 13.89 | | 0.86 | 6.56 | | | |
| | | 10/10/16 | 17/10/16 | 7 | 19.69 | 19.16 | | -0.53 | -2.68 | | | |
| | | 24/10/16 | 31/10/16 | 7 | 19.16 | 18.95 | | -0.20 | -1.06 | | | 359.02 |
| Evolution | | 29/04/19 | 20/05/19 | 21 | 15.36 | 14.65 | | -0.72 | -4.66 | | | |
| | | 5/04/21 | 31/05/21 | 56 | 108.45 | 134.74 | | 26.30 | 24.25 | | | |
| | | 7/06/21 | 21/06/21 | 14 | 133.26 | 122.93 | | -10.33 | -7.75 | | | 9.28 |
| Autoliv | | 22/03/10 | 29/03/10 | 7 | 26.07 | 26.22 | | 0.14 | 0.55 | | | |
| | | 5/04/10 | 3/05/10 | 28 | 25.79 | 27.45 | | 1.66 | 6.45 | | | |
| | | 13/09/10 | 20/09/10 | 7 | 28.99 | 29.40 | | 0.41 | 1.41 | | | |
| | | 8/11/10 | 15/11/10 | 7 | 34.96 | 34.54 | | -0.43 | -1.22 | | | 7.22 |
| Hexagon | | 20/09/10 | 4/10/10 | 14 | 1.59 | 1.70 | | 0.10 | 6.42 | | | 6.42 |
| Atlas Copco A | | 13/12/10 | 27/12/10 | 14 | 2.97 | 3.05 | | 0.08 | 2.70 | | | 2.70 |
| Electrolux | | 26/03/07 | 2/04/07 | 7 | 12.88 | 12.59 | | -0.30 | -2.31 | | | |
| | | 9/04/07 | 23/04/07 | 14 | 13.59 | 13.00 | | -0.60 | -4.40 | | | |
| | | 10/09/12 | 17/09/12 | 7 | 16.65 | 15.55 | | -1.09 | -6.55 | | | |
| | | 26/01/15 | 2/03/15 | 35 | 17.83 | 20.95 | | 3.13 | 17.53 | | | 2.57 |
| Kinnevik | | 12/08/13 | 19/08/13 | 7 | 19.83 | 20.30 | | 0.47 | 2.36 | | | |
| | | 21/10/13 | 4/11/13 | 14 | 23.39 | 23.28 | | -0.11 | -0.47 | | | 1.88 |
| instrument | L/S | date buy | date sell | days | prc buy | prc sell | | prc diff | d % | | | total |
| Essity B | | 30/01/12 | 13/02/12 | 14 | 8.53 | 8.65 | | 0.13 | 1.48 | | | |
| | | 5/03/12 | 12/03/12 | 7 | 9.00 | 8.95 | | -0.05 | -0.57 | | | |
| | | 19/03/12 | 26/03/12 | 7 | 8.90 | 8.95 | | 0.06 | 0.63 | | | 1.54 |
| Assa Abloy | | 13/02/12 | 27/02/12 | 14 | 6.34 | 6.36 | | 0.02 | 0.33 | | | |
| | | 9/04/12 | 23/04/12 | 14 | 6.10 | 6.10 | | -0.00 | -0.01 | | | 0.32 |
| Sinch | | 27/02/17 | 10/04/17 | 42 | 0.98 | 0.98 | | -0.00 | -0.14 | | | |
| | | 15/05/17 | 22/05/17 | 7 | 1.12 | 1.09 | | -0.03 | -2.60 | | | |
| | | 15/04/19 | 29/04/19 | 14 | 0.97 | 0.98 | | 0.01 | 0.52 | | | |
| | | 18/11/19 | 25/11/19 | 7 | 1.73 | 1.76 | | 0.04 | 2.10 | | | |
| | | 2/12/19 | 13/01/20 | 42 | 1.88 | 2.61 | | 0.73 | 38.72 | | | |
| | | 13/07/20 | 7/09/20 | 56 | 6.88 | 6.80 | | -0.08 | -1.12 | | | |
| | | 14/09/20 | 5/10/20 | 21 | 6.85 | 7.56 | | 0.72 | 10.48 | | | |
| | | 12/10/20 | 26/10/20 | 14 | 7.91 | 7.02 | | -0.88 | -11.19 | | | |
| | | 30/11/20 | 14/12/20 | 14 | 9.85 | 10.77 | | 0.92 | 9.33 | | | |
| | | 18/01/21 | 1/02/21 | 14 | 10.70 | 11.09 | | 0.39 | 3.66 | | | |
| | | 1/03/21 | 8/03/21 | 7 | 13.73 | 11.84 | | -1.89 | -13.78 | | | |
| | | 15/03/21 | 29/03/21 | 14 | 12.27 | 12.54 | | 0.27 | 2.24 | | | |
| | | 16/01/23 | 20/02/23 | 35 | 4.13 | 3.09 | | -1.04 | -25.27 | | | 0.30 |
| Volvo | | 14/06/10 | 21/06/10 | 7 | 8.07 | 7.91 | | -0.16 | -2.00 | | | |
| | | 27/12/10 | 3/01/11 | 7 | 11.21 | 11.47 | | 0.26 | 2.34 | | | 0.29 |
| Getinge | | 19/12/11 | 26/12/11 | 7 | 15.80 | 16.27 | | 0.47 | 2.94 | | | |
| | | 2/01/12 | 9/01/12 | 7 | 16.58 | 16.05 | | -0.53 | -3.19 | | | -0.34 |
| Svenska Cellulosa B | | 9/01/12 | 16/01/12 | 7 | 1.99 | 1.98 | | -0.01 | -0.74 | | | |
| | | 23/01/12 | 30/01/12 | 7 | 2.18 | 2.18 | | 0.00 | 0.07 | | | |
| | | 27/02/12 | 5/03/12 | 7 | 2.27 | 2.31 | | 0.04 | 1.74 | | | |
| | | 12/03/12 | 19/03/12 | 7 | 2.29 | 2.28 | | -0.01 | -0.65 | | | |
| | | 26/03/12 | 2/04/12 | 7 | 2.29 | 2.23 | | -0.06 | -2.79 | | | -2.40 |
| instrument | L/S | date buy | date sell | days | prc buy | prc sell | | prc diff | d % | | | total |
| S.E.B | | 17/09/12 | 24/09/12 | 7 | 5.44 | 5.43 | | -0.01 | -0.17 | | | |
| | | 1/10/12 | 22/10/12 | 21 | 5.41 | 5.24 | | -0.16 | -2.97 | | | -3.13 |
| SBB | | 30/09/19 | 7/10/19 | 7 | 1.74 | 1.62 | | -0.12 | -6.95 | | | |
| | | 25/11/19 | 2/12/19 | 7 | 1.90 | 1.92 | | 0.01 | 0.61 | | | -6.38 |
| NIBE Industrier | | 18/12/06 | 12/02/07 | 56 | 0.48 | 0.52 | | 0.03 | 6.24 | | | |
| | | 26/02/07 | 5/03/07 | 7 | 0.53 | 0.48 | | -0.05 | -10.10 | | | |
| | | 24/02/14 | 3/03/14 | 7 | 0.95 | 0.91 | | -0.04 | -4.11 | | | |
| | | 2/06/14 | 9/06/14 | 7 | 1.05 | 1.05 | | -0.00 | -0.19 | | | |
| | | 8/04/19 | 15/04/19 | 7 | 2.58 | 2.57 | | -0.00 | -0.08 | | | -8.67 |
| Swedbank | | 20/02/23 | 13/03/23 | 21 | 16.87 | 14.95 | | -1.91 | -11.35 | | | -11.35 |
Annotations
| 13/05/22 | Atlas Copco B | | | splits 1:4 (four for one) |
| | Atlas Copco A | | | splits 1:4 (four for one) |
| 19/05/21 | Hexagon | | | stock split 1:7 (seven for one) |
| | Investor | | | stock split 1:4 (four for one) |
| 26/07/18 | OMXS 30 | | | Hexagon replaces Fingerprint Cards |
| 29/06/18 | Autoliv | | | spin-off of Veoneer |
| 19/06/18 | Atlas Copco A | | | spin-off Epiroc |
| 2/01/18 | OMXS 30 | | | Lundin drops out as a consequence of the SCA Essity split |
| 2/01/17 | OMXS 30 | | | Autoliv replaces Nokia |
| 4/01/16 | OMXS 30 | | | Fingerprint Cards replaces MTG |
| 10/09/15 | OMXS 30 | | | complete analysis |
| | OMXS 30 | | | complete analysis |
| 3/06/15 | Assa Abloy | | | ex split 1:3 (three for one) |
| 19/05/15 | Svenska Handelsbank | | | ex Split 1:3 (three for one) |
|
|