| | Tue, Jun 23rd, 2026, 13:24UTC |
| | |

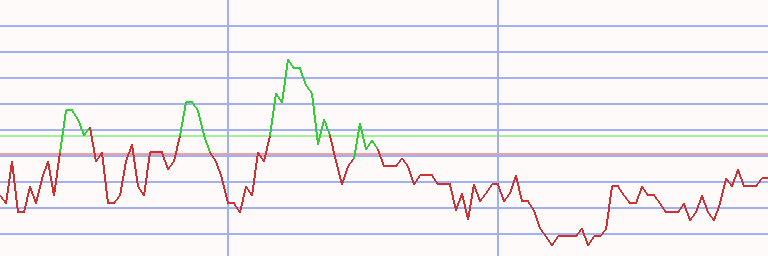
Assessment - Photon Photovoltaik-Aktienindex in Pound sterling - 7/01/24 - RS = 45
⇐
| |
|
instrument |
freshest |
⇓ Δday |
7/01/24 |
⇓ Δwk |
8/21/23 |
prc diff |
⇓ Δ45 |
|
⇓∅-RS |
| |  |
 |
 |
|
L |
 |
SOM Price Index |
1,935.047 |
8/12/24 |
-1.07 |
2,047.633 |
-5.50 |
2,963.142 |
-915.508 |
-30.90 |
|
-22.13 |
| | |
|
|
|
|
|
Altus Power |
2.326 |
8/12/24 |
-6.96 |
2.951 |
-21.18 |
4.788 |
-1.837 |
-38.38 |
|
-29.33 |
| | |
|
|
|
L |
|
Array Tech |
5.561 |
8/12/24 |
-0.99 |
7.570 |
-26.54 |
16.252 |
-8.682 |
-53.42 |
|
-39.62 |
| | |
|
|
|
|
|
BCPG |
0.120 |
8/09/24 |
|
0.135 |
-11.20 |
0.223 |
-0.088 |
-39.52 |
|
-25.48 |
| | |
|
|
|
L |
|
Canadian Solar |
10.442 |
8/12/24 |
-2.51 |
11.082 |
-5.78 |
24.104 |
-13.022 |
-54.02 |
|
-37.13 |
| | |
|
|
|
|
|
Daqo New Energy |
12.704 |
8/12/24 |
-4.74 |
11.320 |
12.23 |
27.262 |
-15.943 |
-58.48 |
|
-43.77 |
| | |
|
|
|
|
|
Encavis |
14.424 |
8/12/24 |
|
14.339 |
0.59 |
11.378 |
2.961 |
26.02 |
|
17.65 |
| | |
|
|
|
L |
|
Enlight Renewable |
1,269.152 |
8/12/24 |
-3.23 |
1,179.748 |
7.58 |
1,313.739 |
-133.990 |
-10.20 |
|
-11.57 |
| | |
|
|
|
L |
|
Enphase Energy |
86.309 |
8/12/24 |
1.16 |
76.935 |
12.18 |
101.997 |
-25.061 |
-24.57 |
|
-17.80 |
| | |
|
|
|
L |
|
First Solar |
173.417 |
8/12/24 |
3.51 |
176.169 |
-1.56 |
142.385 |
33.785 |
23.73 |
|
29.56 |
| | |
|
|
|
S |
|
Flat Glass |
1.183 |
8/12/24 |
-3.63 |
1.165 |
1.57 |
1.952 |
-0.787 |
-40.33 |
|
-30.36 |
| | |
|
|
|
L |
|
GCL Poly Energy |
0.115 |
8/12/24 |
|
0.117 |
-1.72 |
0.130 |
-0.013 |
-9.62 |
|
-8.20 |
| | |
|
|
|
L |
|
Grenergy Renovables |
29.230 |
8/12/24 |
1.32 |
29.230 |
|
20.902 |
8.327 |
39.84 |
|
28.64 |
| | |
|
|
|
L |
|
JinkoSolar |
14.911 |
8/12/24 |
-3.48 |
16.271 |
-8.36 |
26.729 |
-10.458 |
-39.13 |
|
-30.82 |
| | |
|
|
|
L |
|
Neoen |
32.564 |
8/12/24 |
-0.10 |
31.682 |
2.79 |
22.646 |
9.036 |
39.90 |
|
34.04 |
| | |
|
|
|
L |
|
Nextracker |
30.834 |
8/12/24 |
-2.01 |
36.482 |
-15.48 |
29.182 |
7.300 |
25.02 |
|
4.42 |
| | |
|
|
|
|
|
ReNew Energy Global |
4.651 |
8/12/24 |
-0.84 |
4.809 |
-3.29 |
4.553 |
0.257 |
5.64 |
|
-0.37 |
| | |
|
|
|
L |
|
Scatec |
6.269 |
8/12/24 |
-1.46 |
6.366 |
-1.51 |
5.399 |
0.967 |
17.91 |
|
20.18 |
| | |
|
|
|
S |
|
Shoals Technologies |
4.058 |
8/12/24 |
0.20 |
4.833 |
-16.04 |
14.983 |
-10.150 |
-67.74 |
|
-54.01 |
| | |
|
|
|
L |
|
Sino-American Sili |
4.564 |
8/12/24 |
0.80 |
5.389 |
-15.32 |
3.765 |
1.624 |
43.14 |
|
18.53 |
| | |
|
|
|
S |
|
SMA Solar |
18.581 |
8/12/24 |
-1.26 |
22.467 |
-17.30 |
62.468 |
-40.000 |
-64.03 |
|
-55.02 |
| | |
|
|
|
S |
|
SolarEdge |
16.960 |
8/12/24 |
1.13 |
18.961 |
-10.55 |
127.731 |
-108.770 |
-85.16 |
|
-71.10 |
| | |
|
|
|
L |
|
Solaria Energía |
9.376 |
8/12/24 |
1.47 |
9.842 |
-4.74 |
11.131 |
-1.288 |
-11.57 |
|
-11.63 |
| | |
|
|
|
L |
|
Sunnova Energy |
5.237 |
8/12/24 |
-4.47 |
4.137 |
26.58 |
9.976 |
-5.838 |
-58.53 |
|
-35.71 |
| | |
|
|
|
L |
|
SunPower |
0.158 |
8/12/24 |
-4.76 |
2.144 |
-92.62 |
5.579 |
-3.436 |
-61.58 |
|
-32.66 |
| |
|
instrument |
freshest |
⇓ Δday |
7/01/24 |
⇓ Δwk |
8/21/23 |
prc diff |
⇓ Δ45 |
|
⇓∅-RS |
| | |
|
|
|
L |
|
Sunrun |
13.708 |
8/12/24 |
-3.13 |
8.634 |
58.77 |
10.814 |
-2.180 |
-20.16 |
|
-17.65 |
| | |
|
|
|
L |
|
United Renewable |
0.274 |
8/12/24 |
0.89 |
0.322 |
-14.72 |
0.400 |
-0.078 |
-19.55 |
|
-7.15 |
| | |
|
|
|
L |
|
Voltalia |
8.637 |
8/12/24 |
-0.97 |
7.789 |
10.89 |
13.382 |
-5.593 |
-41.80 |
|
-3.58 |
| | |
|
|
|
|
|
West Holdings |
10.487 |
8/09/24 |
-1.38 |
12.166 |
-13.80 |
13.115 |
-0.950 |
-7.24 |
|
-21.75 |
| | |
|
|
|
L |
|
Xinte Energy |
0.764 |
8/12/24 |
1.62 |
0.820 |
-6.91 |
1.392 |
-0.572 |
-41.06 |
|
-27.39 |
| | |
|
|
|
|
|
Xinyi Solar |
0.358 |
8/12/24 |
0.28 |
0.398 |
-10.18 |
0.651 |
-0.253 |
-38.85 |
|
-25.96 |
| PPVX - 30 out of 30 instruments rated - 7/01/24 / 8/21/23 - 8 did rise, Market-Ratio(45) in GBP = 26.67 % |
Technical Chart
Transactions Photon Photovoltaik-Aktienindex in Pound sterling * S45 - 40/47 (1)
|
⇐ |
| |
| L/S | date buy | date sell | days | | instrument | spl | pieces | | prc buy | prc sell | ps short | prc diff | d % | asset | yield | |
| 1/02/06 |
1/16/06 |
14 |
|
- cash - |
| short |
1/16/06 |
1/23/06 |
7 |
|
|
|
Beijing Energy |
100 |
786,383 |
|
0.013 |
0.012 |
0.014 |
0.001 |
9 |
10,852 |
7,008 |
|
| 1/23/06 |
7/24/06 |
182 |
|
- cash - |
| |
7/24/06 |
8/07/06 |
14 |
|
|
|
Beijing Energy |
100 |
1,119,592 |
|
0.010 |
0.009 |
0.010 |
0.000 |
3 |
11,196 |
126 |
|
| 8/07/06 |
12/25/06 |
140 |
|
- cash - |
| |
12/25/06 |
1/01/07 |
7 |
|
|
|
Beijing Energy |
100 |
1,218,086 |
|
0.009 |
0.009 |
0.009 |
0.000 |
0 |
11,206 |
5 |
|
| 1/01/07 |
1/08/07 |
7 |
|
- cash - |
| |
1/08/07 |
1/22/07 |
14 |
|
|
|
Motech Industries |
100 |
1,418 |
|
7.900 |
8.767 |
7.034 |
-0.866 |
-11 |
9,978 |
-95 |
|
| 1/22/07 |
7/28/08 |
553 |
|
- cash - |
| |
7/28/08 |
8/31/09 |
399 |
|
|
|
JA Solar Energy |
100 |
257 |
|
38.815 |
10.819 |
139.259 |
100.444 |
259 |
35,792 |
222 |
|
| 8/31/09 |
5/31/10 |
273 |
|
- cash - |
| |
5/31/10 |
6/28/10 |
28 |
|
|
|
SunPower |
100 |
4,221 |
|
8.479 |
8.539 |
8.420 |
-0.059 |
-1 |
35,541 |
-9 |
|
| 6/28/10 |
7/11/11 |
378 |
|
- cash - |
| |
7/11/11 |
3/04/13 |
602 |
|
|
|
REC Silicon |
100 |
3,899 |
|
9.114 |
1.121 |
74.114 |
65.000 |
713 |
288,974 |
256 |
|
|