| | |
| | |

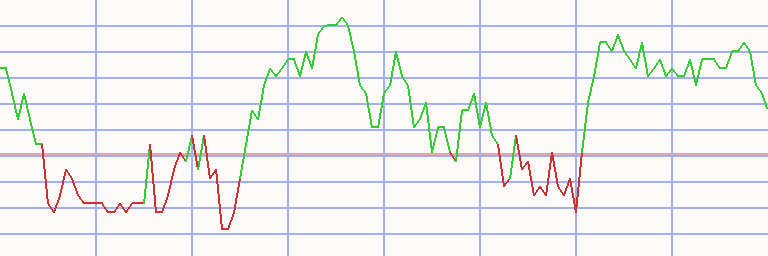
Assessment - OMX Stockholm 30 in Euro - 7/01/24 - RS = 16
⇐
| |
|
⇓instrument |
freshest |
⇓ Δday |
7/01/24 |
⇓ Δwk |
3/11/24 |
prc diff |
⇓ Δ16 |
|
∅-RS |
| |  |
 |
 |
|
|
 |
OMXS30 |
215.761 |
8/12/24 |
0.09 |
226.626 |
-4.79 |
221.461 |
5.165 |
2.33 |
|
12.13 |
| | |
|
|
|
L |
|
SBB |
0.545 |
8/12/24 |
-2.81 |
0.510 |
6.87 |
0.323 |
0.188 |
58.16 |
|
45.10 |
| | |
|
|
|
L |
|
ABB |
48.485 |
8/12/24 |
0.47 |
51.956 |
-6.68 |
42.678 |
9.278 |
21.74 |
|
34.26 |
| | |
|
|
|
L |
|
Atlas Copco A |
15.532 |
8/12/24 |
0.28 |
17.430 |
-10.89 |
15.998 |
1.432 |
8.95 |
|
22.02 |
| | |
|
|
|
L |
|
Investor |
25.075 |
8/12/24 |
0.30 |
25.430 |
-1.40 |
23.510 |
1.921 |
8.17 |
|
25.59 |
| | |
|
|
|
L |
|
Atlas Copco B |
13.629 |
8/12/24 |
|
14.988 |
-9.07 |
14.100 |
0.889 |
6.30 |
|
21.03 |
| | |
|
|
|
L |
|
Tele2 |
9.631 |
8/12/24 |
0.69 |
9.346 |
3.05 |
7.726 |
1.620 |
20.96 |
|
24.22 |
| | |
|
|
|
L |
|
Alfa Laval |
39.235 |
8/12/24 |
0.61 |
41.199 |
-4.77 |
36.452 |
4.746 |
13.02 |
|
19.69 |
| | |
|
|
|
L |
|
Hennes & Mauritz |
13.835 |
8/12/24 |
-0.22 |
14.681 |
-5.76 |
12.753 |
1.928 |
15.12 |
|
3.02 |
| | |
|
|
|
L |
|
AstraZeneca |
151.152 |
8/12/24 |
0.88 |
145.497 |
3.89 |
123.086 |
22.411 |
18.21 |
|
15.54 |
| | |
|
|
|
|
|
S.E.B |
13.213 |
8/12/24 |
-0.10 |
13.835 |
-4.50 |
13.648 |
0.187 |
1.37 |
|
16.86 |
| | |
|
|
|
|
|
Assa Abloy |
26.820 |
8/12/24 |
0.13 |
26.329 |
1.86 |
26.895 |
-0.566 |
-2.10 |
|
11.77 |
| | |
|
|
|
|
|
Boliden |
26.741 |
8/12/24 |
1.33 |
29.810 |
-10.29 |
24.202 |
5.608 |
23.17 |
|
13.12 |
| | |
|
|
|
L |
|
Ericsson |
6.232 |
8/12/24 |
1.14 |
5.883 |
5.93 |
5.118 |
0.765 |
14.94 |
|
20.19 |
| | |
|
|
|
L |
|
Telia Company |
2.710 |
8/12/24 |
0.19 |
2.531 |
7.07 |
2.175 |
0.356 |
16.38 |
|
18.22 |
| | |
|
|
|
|
|
Volvo |
22.419 |
8/12/24 |
-0.12 |
23.970 |
-6.47 |
26.471 |
-2.500 |
-9.45 |
|
11.06 |
| | |
|
|
|
L |
|
Essity B |
26.048 |
8/12/24 |
-0.97 |
24.190 |
7.68 |
22.268 |
1.922 |
8.63 |
|
8.83 |
| | |
|
|
|
|
|
Autoliv |
87.974 |
8/12/24 |
0.10 |
99.932 |
-11.97 |
108.214 |
-8.282 |
-7.65 |
|
3.15 |
| | |
|
|
|
|
|
SKF B |
16.343 |
8/12/24 |
|
18.771 |
-12.94 |
20.285 |
-1.514 |
-7.46 |
|
7.84 |
| | |
|
|
|
|
|
Swedbank |
18.158 |
8/12/24 |
-0.86 |
19.517 |
-6.96 |
20.410 |
-0.894 |
-4.38 |
|
10.77 |
| | |
|
|
|
|
|
Nordea Bank |
10.504 |
8/12/24 |
-0.13 |
11.411 |
-7.95 |
11.244 |
0.167 |
1.49 |
|
7.25 |
| | |
|
|
|
|
|
Hexagon |
8.829 |
8/12/24 |
-0.15 |
10.556 |
-16.36 |
11.152 |
-0.596 |
-5.34 |
|
9.83 |
| | |
|
|
|
|
|
Svenska Cellulosa B |
12.016 |
8/12/24 |
0.81 |
13.682 |
-12.18 |
13.081 |
0.600 |
4.59 |
|
5.49 |
| | |
|
|
|
|
|
Sandvik |
17.763 |
8/12/24 |
-0.54 |
18.850 |
-5.77 |
20.946 |
-2.096 |
-10.01 |
|
1.46 |
| | |
|
|
|
S |
|
Svenska Handelsbank |
8.956 |
8/12/24 |
0.29 |
8.925 |
0.34 |
10.933 |
-2.008 |
-18.36 |
|
1.38 |
| |
|
⇓instrument |
freshest |
⇓ Δday |
7/01/24 |
⇓ Δwk |
3/11/24 |
prc diff |
⇓ Δ16 |
|
∅-RS |
| | |
|
|
|
S |
|
Sinch |
2.275 |
8/12/24 |
-2.15 |
2.336 |
-2.59 |
2.277 |
0.058 |
2.56 |
|
8.49 |
| | |
|
|
|
L |
|
Electrolux |
7.524 |
8/12/24 |
-0.26 |
7.673 |
-1.94 |
8.035 |
-0.362 |
-4.51 |
|
-15.57 |
| | |
|
|
|
S |
|
Evolution |
87.465 |
8/12/24 |
-0.88 |
96.925 |
-9.76 |
117.227 |
-20.301 |
-17.32 |
|
-6.85 |
| | |
|
|
|
S |
|
Getinge |
17.364 |
8/12/24 |
-0.10 |
15.909 |
9.15 |
18.436 |
-2.527 |
-13.71 |
|
-9.98 |
| | |
|
|
|
|
|
Kinnevik |
6.964 |
8/12/24 |
-0.36 |
7.786 |
-10.55 |
9.723 |
-1.937 |
-19.92 |
|
-20.53 |
| | |
|
|
|
|
|
NIBE Industrier |
3.909 |
8/12/24 |
0.18 |
3.959 |
-1.26 |
5.238 |
-1.279 |
-24.42 |
|
-29.59 |
| OMXS 30 - 30 out of 30 instruments rated - 7/01/24 / 3/11/24 - 17 did rise, Market-Ratio(16) in EUR = 56.67 % |
| Stock Exchange Currency: SEK kr Swedish krona |
Technical Chart
Transactions OMX Stockholm 30 in Euro * S16 - 40/40 (2)
|
⇐ |
| |
| L/S | date buy | date sell | days | | instrument | spl | pieces | | prc buy | prc sell | ps short | prc diff | d % | asset | yield | |
| 1/02/06 |
6/05/06 |
154 |
|
- cash - |
| short |
6/05/06 |
9/04/06 |
91 |
|
|
|
Ericsson |
50 |
419 |
|
11.930 |
12.795 |
11.066 |
-0.864 |
-7 |
9,638 |
-26 |
|
| |
|
|
|
|
|
|
Tele2 |
50 |
618 |
|
8.080 |
7.655 |
8.529 |
0.448 |
6 |
9,915 |
24 |
|
| 100 |
-1 |
-3 | |
| 9/04/06 |
7/23/07 |
322 |
|
- cash - |
| |
7/23/07 |
9/24/07 |
63 |
|
|
|
AstraZeneca |
50 |
129 |
|
38.326 |
35.157 |
41.780 |
3.454 |
9 |
10,361 |
65 |
|
| |
|
|
|
|
|
|
Telia Company |
50 |
917 |
|
5.419 |
6.340 |
4.498 |
-0.921 |
-17 |
9,516 |
-66 |
|
| 100 |
-4 |
-21 | |
| 9/24/07 |
10/01/07 |
7 |
|
- cash - |
| |
10/01/07 |
10/08/07 |
7 |
|
|
|
AstraZeneca |
50 |
128 |
|
37.023 |
36.802 |
37.246 |
0.223 |
1 |
9,544 |
37 |
|
| |
|
|
|
|
|
|
Securitas |
50 |
504 |
|
9.474 |
9.433 |
9.514 |
0.041 |
0 |
9,565 |
25 |
|
| 100 |
1 |
31 | |
| 10/08/07 |
10/15/07 |
7 |
|
- cash - |
| |
10/15/07 |
11/26/07 |
42 |
|
|
|
Boliden |
50 |
351 |
|
13.623 |
9.720 |
19.092 |
5.469 |
40 |
11,485 |
1,779 |
|
| |
|
|
|
|
|
|
Ericsson |
50 |
461 |
|
10.360 |
8.401 |
12.776 |
2.416 |
23 |
12,598 |
518 |
|
| 100 |
32 |
997 | |
| 11/26/07 |
12/31/07 |
35 |
|
- cash - |
| |
12/31/07 |
4/21/08 |
112 |
|
|
|
Boliden |
50 |
758 |
|
8.302 |
7.014 |
9.827 |
1.525 |
18 |
13,754 |
73 |
|
| |
|
|
|
|
|
|
Ericsson |
50 |
838 |
|
7.522 |
7.704 |
7.340 |
-0.182 |
-2 |
13,601 |
-8 |
|
| 100 |
8 |
28 | |
| 4/21/08 |
6/16/08 |
56 |
|
- cash - |
| |
6/16/08 |
1/26/09 |
224 |
|
|
|
Boliden |
50 |
1,229 |
|
5.529 |
1.602 |
19.081 |
13.552 |
245 |
30,257 |
653 |
|
| |
|
|
|
|
|
|
Swedbank |
50 |
497 |
|
13.676 |
2.780 |
67.272 |
53.596 |
392 |
56,894 |
1,241 |
|
| 100 |
319 |
931 | |
| 1/26/09 |
2/23/09 |
28 |
|
- cash - |
| |
2/23/09 |
3/09/09 |
14 |
|
|
|
S.E.B |
50 |
8,414 |
|
3.381 |
1.813 |
6.303 |
2.923 |
86 |
81,486 |
> 999,999 |
|
| |
|
|
|
|
|
|
Swedbank |
50 |
13,514 |
|
2.105 |
2.054 |
2.158 |
0.053 |
3 |
82,198 |
91 |
|
| 100 |
44 |
1,466,111 | |
| 3/09/09 |
5/03/10 |
420 |
|
- cash - |
| |
5/03/10 |
5/10/10 |
7 |
|
|
|
Lundin |
50 |
10,462 |
|
3.928 |
3.758 |
4.107 |
0.178 |
5 |
84,065 |
914 |
|
| |
|
|
|
|
|
|
Nokia |
50 |
4,840 |
|
8.490 |
8.105 |
8.894 |
0.404 |
5 |
86,021 |
1,030 |
|
| 100 |
5 |
970 | |
| L/S | date buy | date sell | days | | instrument | spl | pieces | | prc buy | prc sell | ps short | prc diff | d % | asset | yield | |
| 5/10/10 |
6/28/10 |
49 |
|
- cash - |
| |
6/28/10 |
7/05/10 |
7 |
|
|
|
Lundin |
50 |
11,805 |
|
3.643 |
3.959 |
3.327 |
-0.316 |
-9 |
82,292 |
-99 |
|
| |
|
|
|
|
|
|
Nokia |
50 |
6,383 |
|
6.738 |
6.593 |
6.886 |
0.148 |
2 |
83,235 |
210 |
|
| 100 |
-3 |
-82 | |
| 7/05/10 |
8/09/10 |
35 |
|
- cash - |
| |
8/09/10 |
8/23/10 |
14 |
|
|
|
Lundin |
50 |
8,960 |
|
4.644 |
4.457 |
4.840 |
0.196 |
4 |
84,988 |
193 |
|
| |
|
|
|
|
|
|
Nokia |
50 |
5,870 |
|
7.090 |
6.740 |
7.459 |
0.369 |
5 |
87,151 |
275 |
|
| 100 |
5 |
232 | |
| 8/23/10 |
4/11/11 |
231 |
|
- cash - |
| |
4/11/11 |
4/18/11 |
7 |
|
|
|
AstraZeneca |
50 |
1,282 |
|
33.972 |
34.188 |
33.756 |
-0.216 |
-1 |
86,875 |
-28 |
|
| |
|
|
|
|
|
|
Nokia |
50 |
7,307 |
|
5.966 |
6.088 |
5.844 |
-0.122 |
-2 |
85,984 |
-66 |
|
| 100 |
-1 |
-51 | |
| 4/18/11 |
5/30/11 |
42 |
|
- cash - |
| |
5/30/11 |
7/04/11 |
35 |
|
|
|
Nokia |
50 |
9,528 |
|
4.512 |
4.367 |
4.661 |
0.149 |
3 |
87,407 |
40 |
|
| |
|
|
|
|
|
|
Telia Company |
50 |
8,111 |
|
5.300 |
4.997 |
5.622 |
0.322 |
6 |
90,017 |
85 |
|
| 100 |
5 |
61 | |
| 7/04/11 |
7/11/11 |
7 |
|
- cash - |
| |
7/11/11 |
11/28/11 |
140 |
|
|
|
Nokia |
50 |
11,384 |
|
3.954 |
4.082 |
3.825 |
-0.128 |
-3 |
88,557 |
-8 |
|
| |
|
|
|
|
|
|
SSAB |
50 |
4,788 |
|
9.401 |
6.652 |
13.285 |
3.884 |
41 |
107,155 |
146 |
|
| 100 |
19 |
58 | |
| 11/28/11 |
5/14/12 |
168 |
|
- cash - |
| |
5/14/12 |
7/23/12 |
70 |
|
|
|
ABB |
50 |
4,132 |
|
12.966 |
14.168 |
11.765 |
-1.201 |
-9 |
102,192 |
-40 |
|
| |
|
|
|
|
|
|
Nokia |
50 |
22,912 |
|
2.338 |
1.752 |
3.121 |
0.783 |
33 |
120,125 |
351 |
|
| 100 |
12 |
81 | |
| 7/23/12 |
6/24/13 |
336 |
|
- cash - |
| |
6/24/13 |
7/08/13 |
14 |
|
|
|
Boliden |
50 |
6,289 |
|
9.549 |
9.256 |
9.852 |
0.303 |
3 |
122,029 |
126 |
|
| |
|
|
|
|
|
|
Tele2 |
50 |
6,843 |
|
8.778 |
9.227 |
8.329 |
-0.449 |
-5 |
118,958 |
-75 |
|
| 100 |
-1 |
-22 | |
| 7/08/13 |
10/13/14 |
462 |
|
- cash - |
| |
10/13/14 |
11/03/14 |
21 |
|
|
|
Lundin |
50 |
5,324 |
|
11.171 |
11.400 |
10.943 |
-0.229 |
-2 |
117,739 |
-30 |
|
| |
|
|
|
|
|
|
MTG |
50 |
2,572 |
|
23.125 |
24.302 |
21.949 |
-1.176 |
-5 |
114,713 |
-60 |
|
| 100 |
-4 |
-47 | |
| L/S | date buy | date sell | days | | instrument | spl | pieces | | prc buy | prc sell | ps short | prc diff | d % | asset | yield | |
| 11/03/14 |
6/08/15 |
217 |
|
- cash - |
| |
6/08/15 |
10/26/15 |
140 |
|
|
|
SSAB |
50 |
11,202 |
|
5.120 |
3.388 |
7.737 |
2.617 |
51 |
144,034 |
193 |
|
| |
|
|
|
|
|
|
Telia Company |
50 |
10,907 |
|
5.259 |
4.765 |
5.804 |
0.545 |
10 |
149,976 |
29 |
|
| 100 |
31 |
101 | |
| 10/26/15 |
11/02/15 |
7 |
|
- cash - |
| |
11/02/15 |
12/14/15 |
42 |
|
|
|
SSAB |
50 |
22,201 |
|
3.378 |
2.601 |
4.386 |
1.008 |
30 |
172,353 |
868 |
|
| |
|
|
|
|
|
|
SKF A |
50 |
4,667 |
|
16.068 |
14.663 |
17.608 |
1.539 |
10 |
179,538 |
121 |
|
| 100 |
20 |
378 | |
| 12/14/15 |
12/21/15 |
7 |
|
- cash - |
| |
12/21/15 |
12/28/15 |
7 |
|
|
|
SSAB |
50 |
41,363 |
|
2.170 |
2.409 |
1.932 |
-0.239 |
-11 |
169,662 |
-100 |
|
| |
|
|
|
|
|
|
SKF A |
50 |
6,148 |
|
14.601 |
15.095 |
14.108 |
-0.493 |
-3 |
166,628 |
-83 |
|
| 100 |
-7 |
-98 | |
| 12/28/15 |
1/04/16 |
7 |
|
- cash - |
| |
1/04/16 |
4/04/16 |
91 |
|
|
|
SSAB |
50 |
34,160 |
|
2.439 |
3.262 |
1.615 |
-0.823 |
-34 |
138,498 |
-81 |
|
| |
|
|
|
|
|
|
SKF A |
50 |
5,729 |
|
14.542 |
15.448 |
13.637 |
-0.906 |
-6 |
133,310 |
-23 |
|
| 100 |
-20 |
-59 | |
| 4/04/16 |
4/11/16 |
7 |
|
- cash - |
| |
4/11/16 |
4/18/16 |
7 |
|
|
|
Nordea Bank |
50 |
8,016 |
|
8.315 |
8.483 |
8.147 |
-0.168 |
-2 |
131,963 |
-66 |
|
| |
|
|
|
|
|
|
S.E.B |
50 |
7,869 |
|
8.471 |
8.777 |
8.166 |
-0.305 |
-4 |
129,561 |
-85 |
|
| 100 |
-3 |
-77 | |
| 4/18/16 |
6/13/16 |
56 |
|
- cash - |
| |
6/13/16 |
6/20/16 |
7 |
|
|
|
Ericsson |
50 |
9,867 |
|
6.565 |
6.978 |
6.152 |
-0.413 |
-6 |
125,486 |
-97 |
|
| |
|
|
|
|
|
|
SSAB |
50 |
29,543 |
|
2.193 |
2.173 |
2.213 |
0.020 |
1 |
126,092 |
62 |
|
| 100 |
-3 |
-76 | |
| 6/20/16 |
6/27/16 |
7 |
|
- cash - |
| |
6/27/16 |
7/11/16 |
14 |
|
|
|
Nordea Bank |
50 |
8,765 |
|
7.193 |
7.499 |
6.887 |
-0.306 |
-4 |
123,410 |
-68 |
|
| |
|
|
|
|
|
|
SSAB |
50 |
31,527 |
|
2.000 |
2.427 |
1.573 |
-0.427 |
-21 |
109,946 |
-100 |
|
| 100 |
-13 |
-97 | |
| 7/11/16 |
8/14/17 |
399 |
|
- cash - |
| |
8/14/17 |
9/11/17 |
28 |
|
|
|
AstraZeneca |
50 |
1,111 |
|
49.454 |
54.468 |
44.441 |
-5.013 |
-10 |
104,376 |
-75 |
|
| |
|
|
|
|
|
|
Fingerprint Cards |
50 |
13,994 |
|
3.930 |
3.461 |
4.463 |
0.532 |
14 |
111,827 |
424 |
|
| 100 |
2 |
25 | |
| L/S | date buy | date sell | days | | instrument | spl | pieces | | prc buy | prc sell | ps short | prc diff | d % | asset | yield | |
| 9/11/17 |
2/05/18 |
147 |
|
- cash - |
| |
2/05/18 |
3/12/18 |
35 |
|
|
|
Hennes & Mauritz |
50 |
3,915 |
|
14.279 |
13.451 |
15.158 |
0.879 |
6 |
115,267 |
86 |
|
| |
|
|
|
|
|
|
Fingerprint Cards |
50 |
49,974 |
|
1.119 |
0.992 |
1.263 |
0.144 |
13 |
122,459 |
253 |
|
| 100 |
10 |
158 | |
| 3/12/18 |
3/26/18 |
14 |
|
- cash - |
| |
3/26/18 |
4/02/18 |
7 |
|
|
|
Getinge |
50 |
6,742 |
|
9.081 |
9.198 |
8.965 |
-0.117 |
-1 |
121,674 |
-49 |
|
| |
|
|
|
|
|
|
Fingerprint Cards |
50 |
78,248 |
|
0.783 |
0.780 |
0.785 |
0.003 |
0 |
121,887 |
20 |
|
| 100 |
0 |
-22 | |
| 4/02/18 |
4/09/18 |
7 |
|
- cash - |
| |
4/09/18 |
4/23/18 |
14 |
|
|
|
Hennes & Mauritz |
50 |
4,968 |
|
12.265 |
13.154 |
11.377 |
-0.888 |
-7 |
117,475 |
-86 |
|
| |
|
|
|
|
|
|
Fingerprint Cards |
50 |
76,169 |
|
0.800 |
0.786 |
0.815 |
0.014 |
2 |
118,562 |
59 |
|
| 100 |
-3 |
-51 | |
| 4/23/18 |
7/02/18 |
70 |
|
- cash - |
| |
7/02/18 |
7/09/18 |
7 |
|
|
|
Getinge |
50 |
7,640 |
|
7.759 |
8.181 |
7.337 |
-0.422 |
-5 |
115,339 |
-95 |
|
| |
|
|
|
|
|
|
Fingerprint Cards |
50 |
90,826 |
|
0.653 |
0.628 |
0.678 |
0.026 |
4 |
117,671 |
648 |
|
| 100 |
-1 |
-33 | |
| 7/09/18 |
10/29/18 |
112 |
|
- cash - |
| |
10/29/18 |
2/04/19 |
98 |
|
|
|
Boliden |
50 |
3,085 |
|
19.070 |
21.765 |
16.375 |
-2.695 |
-14 |
109,358 |
-43 |
|
| |
|
|
|
|
|
|
Electrolux |
50 |
3,382 |
|
17.398 |
22.965 |
11.831 |
-5.567 |
-32 |
90,529 |
-76 |
|
| 100 |
-23 |
-62 | |
| 2/04/19 |
6/03/19 |
119 |
|
- cash - |
| |
6/03/19 |
6/10/19 |
7 |
|
|
|
Swedbank |
50 |
3,557 |
|
12.722 |
13.328 |
12.117 |
-0.605 |
-5 |
88,376 |
-92 |
|
| |
|
|
|
|
|
|
Autoliv |
50 |
808 |
|
55.993 |
60.784 |
51.203 |
-4.791 |
-9 |
84,505 |
-99 |
|
| 100 |
-7 |
-97 | |
| 6/10/19 |
8/05/19 |
56 |
|
- cash - |
| |
8/05/19 |
9/02/19 |
28 |
|
|
|
SSAB |
50 |
17,861 |
|
2.366 |
2.498 |
2.234 |
-0.132 |
-6 |
82,147 |
-53 |
|
| |
|
|
|
|
|
|
Swedbank |
50 |
3,575 |
|
11.818 |
11.389 |
12.264 |
0.446 |
4 |
83,741 |
62 |
|
| 100 |
-1 |
-11 | |
| 9/02/19 |
3/02/20 |
182 |
|
- cash - |
| |
3/02/20 |
6/22/20 |
112 |
|
|
|
Electrolux |
50 |
2,298 |
|
18.217 |
14.678 |
22.609 |
4.392 |
24 |
93,835 |
102 |
|
| |
|
|
|
|
|
|
Kinnevik |
50 |
2,239 |
|
18.702 |
22.953 |
14.450 |
-4.252 |
-23 |
84,315 |
-57 |
|
| 100 |
1 |
2 | |
| L/S | date buy | date sell | days | | instrument | spl | pieces | | prc buy | prc sell | ps short | prc diff | d % | asset | yield | |
| 6/22/20 |
11/15/21 |
511 |
|
- cash - |
| |
11/15/21 |
11/22/21 |
7 |
|
|
|
Ericsson |
50 |
4,420 |
|
9.536 |
9.178 |
9.908 |
0.372 |
4 |
85,960 |
636 |
|
| |
|
|
|
|
|
|
Hennes & Mauritz |
50 |
2,467 |
|
17.089 |
16.083 |
18.159 |
1.070 |
6 |
88,599 |
2,271 |
|
| 100 |
5 |
1,226 | |
| 11/22/21 |
11/29/21 |
7 |
|
- cash - |
| |
11/29/21 |
12/13/21 |
14 |
|
|
|
Hennes & Mauritz |
50 |
2,788 |
|
15.884 |
16.022 |
15.746 |
-0.138 |
-1 |
88,214 |
-20 |
|
| |
|
|
|
|
|
|
Kinnevik |
50 |
1,380 |
|
32.092 |
30.350 |
33.934 |
1.842 |
6 |
90,756 |
328 |
|
| 100 |
2 |
87 | |
| 12/13/21 |
2/28/22 |
77 |
|
- cash - |
| |
2/28/22 |
6/27/22 |
119 |
|
|
|
Kinnevik |
50 |
1,981 |
|
22.905 |
16.088 |
32.612 |
9.707 |
42 |
109,985 |
196 |
|
| |
|
|
|
|
|
|
Sinch |
50 |
5,934 |
|
7.647 |
3.572 |
16.372 |
8.725 |
114 |
161,761 |
933 |
|
| 100 |
78 |
489 | |
| 6/27/22 |
7/04/22 |
7 |
|
- cash - |
| |
7/04/22 |
8/15/22 |
42 |
|
|
|
Kinnevik |
50 |
5,293 |
|
15.278 |
17.003 |
13.554 |
-1.725 |
-11 |
152,632 |
-65 |
|
| |
|
|
|
|
|
|
Sinch |
50 |
26,553 |
|
3.046 |
2.232 |
4.158 |
1.111 |
36 |
182,138 |
1,392 |
|
| 100 |
13 |
180 | |
| 8/15/22 |
8/22/22 |
7 |
|
- cash - |
| |
8/22/22 |
8/29/22 |
7 |
|
|
|
Getinge |
50 |
4,589 |
|
19.842 |
19.008 |
20.713 |
0.871 |
4 |
186,133 |
839 |
|
| |
|
|
|
|
|
|
Sinch |
50 |
48,878 |
|
1.863 |
1.809 |
1.920 |
0.056 |
3 |
188,875 |
369 |
|
| 100 |
4 |
565 | |
| 8/29/22 |
9/05/22 |
7 |
|
- cash - |
| |
9/05/22 |
10/17/22 |
42 |
|
|
|
Getinge |
50 |
4,980 |
|
18.960 |
18.433 |
19.502 |
0.542 |
3 |
191,574 |
28 |
|
| |
|
|
|
|
|
|
Sinch |
50 |
55,226 |
|
1.710 |
1.814 |
1.607 |
-0.103 |
-6 |
185,864 |
-42 |
|
| 100 |
-2 |
-13 | |
| 10/17/22 |
6/26/23 |
252 |
|
- cash - |
| |
6/26/23 |
7/03/23 |
7 |
|
|
|
Telia Company |
50 |
46,393 |
|
2.003 |
2.021 |
1.985 |
-0.018 |
-1 |
185,032 |
-37 |
|
| |
|
|
|
|
|
|
SBB |
50 |
314,297 |
|
0.296 |
0.350 |
0.241 |
-0.054 |
-18 |
167,908 |
-100 |
|
| 100 |
-10 |
-99 | |
| 7/03/23 |
8/21/23 |
49 |
|
- cash - |
| |
8/21/23 |
9/04/23 |
14 |
|
|
|
NIBE Industrier |
50 |
12,914 |
|
6.501 |
6.935 |
6.067 |
-0.434 |
-7 |
162,302 |
-83 |
|
| |
|
|
|
|
|
|
SBB |
50 |
302,273 |
|
0.278 |
0.301 |
0.254 |
-0.023 |
-8 |
155,244 |
-90 |
|
| 100 |
-8 |
-87 | |
| L/S | date buy | date sell | days | | instrument | spl | pieces | | prc buy | prc sell | ps short | prc diff | d % | asset | yield | |
| 9/04/23 |
9/11/23 |
7 |
|
- cash - |
| |
9/11/23 |
11/27/23 |
77 |
|
|
|
NIBE Industrier |
50 |
11,812 |
|
6.571 |
5.550 |
7.781 |
1.210 |
18 |
169,531 |
123 |
|
| |
|
|
|
|
|
|
SBB |
50 |
261,495 |
|
0.297 |
0.337 |
0.257 |
-0.040 |
-14 |
158,979 |
-50 |
|
| 100 |
2 |
12 | |
| 11/27/23 |
6/20/26 |
936 |
|
- cash - |
| accum | 6/05/06 |
11/27/23 | 1841 |
days out of 7474 invested (25%) |
1,490 |
158,979 |
73 |
|
Instrument Related Contribution
| instrument | L/S | date buy | date sell | days | prc buy | prc sell | ps short | prc diff | d % | spl | di % | total |
| Swedbank | short | 6/16/08 | 1/26/09 | 224 | 13.68 | 2.78 | 67.27 | 53.60 | 391.90 | 50 | 195.95 | |
| | | 2/23/09 | 3/09/09 | 14 | 2.11 | 2.05 | 2.16 | 0.05 | 2.50 | | 1.25 | |
| | | 6/03/19 | 6/10/19 | 7 | 12.72 | 13.33 | 12.12 | -0.61 | -4.76 | | -2.38 | |
| | | 8/05/19 | 9/02/19 | 28 | 11.82 | 11.39 | 12.26 | 0.45 | 3.77 | | 1.89 | 198.05 |
| Boliden | | 10/15/07 | 11/26/07 | 42 | 13.62 | 9.72 | 19.09 | 5.47 | 40.15 | | 20.07 | |
| | | 12/31/07 | 4/21/08 | 112 | 8.30 | 7.01 | 9.83 | 1.52 | 18.37 | | 9.18 | |
| | | 6/16/08 | 1/26/09 | 224 | 5.53 | 1.60 | 19.08 | 13.55 | 245.11 | | 122.55 | |
| | | 6/24/13 | 7/08/13 | 14 | 9.55 | 9.26 | 9.85 | 0.30 | 3.17 | | 1.59 | |
| | | 10/29/18 | 2/04/19 | 98 | 19.07 | 21.76 | 16.38 | -2.69 | -14.13 | | -7.07 | 175.45 |
| Sinch | | 2/28/22 | 6/27/22 | 119 | 7.65 | 3.57 | 16.37 | 8.73 | 114.10 | | 57.05 | |
| | | 7/04/22 | 8/15/22 | 42 | 3.05 | 2.23 | 4.16 | 1.11 | 36.48 | | 18.24 | |
| | | 8/22/22 | 8/29/22 | 7 | 1.86 | 1.81 | 1.92 | 0.06 | 3.01 | | 1.50 | |
| | | 9/05/22 | 10/17/22 | 42 | 1.71 | 1.81 | 1.61 | -0.10 | -6.05 | | -3.02 | 82.79 |
| S.E.B | | 2/23/09 | 3/09/09 | 14 | 3.38 | 1.81 | 6.30 | 2.92 | 86.46 | | 43.23 | |
| | | 4/11/16 | 4/18/16 | 7 | 8.47 | 8.78 | 8.17 | -0.31 | -3.60 | | -1.80 | 40.65 |
| Nokia | | 5/03/10 | 5/10/10 | 7 | 8.49 | 8.10 | 8.89 | 0.40 | 4.76 | | 2.38 | |
| | | 6/28/10 | 7/05/10 | 7 | 6.74 | 6.59 | 6.89 | 0.15 | 2.19 | | 1.10 | |
| | | 8/09/10 | 8/23/10 | 14 | 7.09 | 6.74 | 7.46 | 0.37 | 5.20 | | 2.60 | |
| | | 4/11/11 | 4/18/11 | 7 | 5.97 | 6.09 | 5.84 | -0.12 | -2.04 | | -1.02 | |
| | | 5/30/11 | 7/04/11 | 35 | 4.51 | 4.37 | 4.66 | 0.15 | 3.31 | | 1.66 | |
| | | 7/11/11 | 11/28/11 | 140 | 3.95 | 4.08 | 3.83 | -0.13 | -3.24 | | -1.62 | |
| | | 5/14/12 | 7/23/12 | 70 | 2.34 | 1.75 | 3.12 | 0.78 | 33.47 | | 16.74 | 22.71 |
| SSAB | | 7/11/11 | 11/28/11 | 140 | 9.40 | 6.65 | 13.28 | 3.88 | 41.32 | | 20.66 | |
| | | 6/08/15 | 10/26/15 | 140 | 5.12 | 3.39 | 7.74 | 2.62 | 51.12 | | 25.56 | |
| | | 11/02/15 | 12/14/15 | 42 | 3.38 | 2.60 | 4.39 | 1.01 | 29.84 | | 14.92 | |
| | | 12/21/15 | 12/28/15 | 7 | 2.17 | 2.41 | 1.93 | -0.24 | -11.00 | | -5.50 | |
| | | 1/04/16 | 4/04/16 | 91 | 2.44 | 3.26 | 1.62 | -0.82 | -33.77 | | -16.88 | |
| | | 6/13/16 | 6/20/16 | 7 | 2.19 | 2.17 | 2.21 | 0.02 | 0.93 | | 0.47 | |
| | | 6/27/16 | 7/11/16 | 14 | 2.00 | 2.43 | 1.57 | -0.43 | -21.35 | | -10.68 | |
| | | 8/05/19 | 9/02/19 | 28 | 2.37 | 2.50 | 2.23 | -0.13 | -5.58 | | -2.79 | 19.30 |
| instrument | L/S | date buy | date sell | days | prc buy | prc sell | ps short | prc diff | d % | spl | di % | total |
| Fingerprint Cards | | 8/14/17 | 9/11/17 | 28 | 3.93 | 3.46 | 4.46 | 0.53 | 13.55 | | 6.77 | |
| | | 2/05/18 | 3/12/18 | 35 | 1.12 | 0.99 | 1.26 | 0.14 | 12.86 | | 6.43 | |
| | | 3/26/18 | 4/02/18 | 7 | 0.78 | 0.78 | 0.79 | 0.00 | 0.35 | | 0.17 | |
| | | 4/09/18 | 4/23/18 | 14 | 0.80 | 0.79 | 0.81 | 0.01 | 1.78 | | 0.89 | |
| | | 7/02/18 | 7/09/18 | 7 | 0.65 | 0.63 | 0.68 | 0.03 | 3.93 | | 1.97 | 17.11 |
| NIBE Industrier | | 8/21/23 | 9/04/23 | 14 | 6.50 | 6.93 | 6.07 | -0.43 | -6.68 | | -3.34 | |
| | | 9/11/23 | 11/27/23 | 77 | 6.57 | 5.55 | 7.78 | 1.21 | 18.41 | | 9.20 | 5.56 |
| Ericsson | | 6/05/06 | 9/04/06 | 91 | 11.93 | 12.79 | 11.07 | -0.86 | -7.24 | | -3.62 | |
| | | 10/15/07 | 11/26/07 | 42 | 10.36 | 8.40 | 12.78 | 2.42 | 23.32 | | 11.66 | |
| | | 12/31/07 | 4/21/08 | 112 | 7.52 | 7.70 | 7.34 | -0.18 | -2.43 | | -1.21 | |
| | | 6/13/16 | 6/20/16 | 7 | 6.56 | 6.98 | 6.15 | -0.41 | -6.29 | | -3.15 | |
| | | 11/15/21 | 11/22/21 | 7 | 9.54 | 9.18 | 9.91 | 0.37 | 3.90 | | 1.95 | 4.98 |
| Kinnevik | | 3/02/20 | 6/22/20 | 112 | 18.70 | 22.95 | 14.45 | -4.25 | -22.74 | | -11.37 | |
| | | 11/29/21 | 12/13/21 | 14 | 32.09 | 30.35 | 33.93 | 1.84 | 5.74 | | 2.87 | |
| | | 2/28/22 | 6/27/22 | 119 | 22.91 | 16.09 | 32.61 | 9.71 | 42.38 | | 21.19 | |
| | | 7/04/22 | 8/15/22 | 42 | 15.28 | 17.00 | 13.55 | -1.72 | -11.29 | | -5.64 | 4.26 |
| Hennes & Mauritz | | 2/05/18 | 3/12/18 | 35 | 14.28 | 13.45 | 15.16 | 0.88 | 6.15 | | 3.08 | |
| | | 4/09/18 | 4/23/18 | 14 | 12.27 | 13.15 | 11.38 | -0.89 | -7.24 | | -3.62 | |
| | | 11/15/21 | 11/22/21 | 7 | 17.09 | 16.08 | 18.16 | 1.07 | 6.26 | | 3.13 | |
| | | 11/29/21 | 12/13/21 | 14 | 15.88 | 16.02 | 15.75 | -0.14 | -0.87 | | -0.43 | 2.01 |
| Securitas | | 10/01/07 | 10/08/07 | 7 | 9.47 | 9.43 | 9.51 | 0.04 | 0.43 | | 0.22 | 0.22 |
| Getinge | | 3/26/18 | 4/02/18 | 7 | 9.08 | 9.20 | 8.96 | -0.12 | -1.28 | | -0.64 | |
| | | 7/02/18 | 7/09/18 | 7 | 7.76 | 8.18 | 7.34 | -0.42 | -5.44 | | -2.72 | |
| | | 8/22/22 | 8/29/22 | 7 | 19.84 | 19.01 | 20.71 | 0.87 | 4.39 | | 2.19 | |
| | | 9/05/22 | 10/17/22 | 42 | 18.96 | 18.43 | 19.50 | 0.54 | 2.86 | | 1.43 | 0.19 |
| instrument | L/S | date buy | date sell | days | prc buy | prc sell | ps short | prc diff | d % | spl | di % | total |
| Tele2 | | 6/05/06 | 9/04/06 | 91 | 8.08 | 7.66 | 8.53 | 0.45 | 5.55 | | 2.77 | |
| | | 6/24/13 | 7/08/13 | 14 | 8.78 | 9.23 | 8.33 | -0.45 | -5.11 | | -2.56 | 0.15 |
| SKF A | | 11/02/15 | 12/14/15 | 42 | 16.07 | 14.66 | 17.61 | 1.54 | 9.58 | | 4.79 | |
| | | 12/21/15 | 12/28/15 | 7 | 14.60 | 15.09 | 14.11 | -0.49 | -3.38 | | -1.69 | |
| | | 1/04/16 | 4/04/16 | 91 | 14.54 | 15.45 | 13.64 | -0.91 | -6.23 | | -3.11 | -0.19 |
| AstraZeneca | | 7/23/07 | 9/24/07 | 63 | 38.33 | 35.16 | 41.78 | 3.45 | 9.01 | | 4.51 | |
| | | 10/01/07 | 10/08/07 | 7 | 37.02 | 36.80 | 37.25 | 0.22 | 0.60 | | 0.30 | |
| | | 4/11/11 | 4/18/11 | 7 | 33.97 | 34.19 | 33.76 | -0.22 | -0.64 | | -0.32 | |
| | | 8/14/17 | 9/11/17 | 28 | 49.45 | 54.47 | 44.44 | -5.01 | -10.14 | | -5.07 | -0.81 |
| Lundin | | 5/03/10 | 5/10/10 | 7 | 3.93 | 3.76 | 4.11 | 0.18 | 4.54 | | 2.27 | |
| | | 6/28/10 | 7/05/10 | 7 | 3.64 | 3.96 | 3.33 | -0.32 | -8.67 | | -4.34 | |
| | | 8/09/10 | 8/23/10 | 14 | 4.64 | 4.46 | 4.84 | 0.20 | 4.21 | | 2.11 | |
| | | 10/13/14 | 11/03/14 | 21 | 11.17 | 11.40 | 10.94 | -0.23 | -2.05 | | -1.02 | -1.13 |
| Telia Company | | 7/23/07 | 9/24/07 | 63 | 5.42 | 6.34 | 4.50 | -0.92 | -17.00 | | -8.50 | |
| | | 5/30/11 | 7/04/11 | 35 | 5.30 | 5.00 | 5.62 | 0.32 | 6.07 | | 3.04 | |
| | | 6/08/15 | 10/26/15 | 140 | 5.26 | 4.77 | 5.80 | 0.54 | 10.36 | | 5.18 | |
| | | 6/26/23 | 7/03/23 | 7 | 2.00 | 2.02 | 1.99 | -0.02 | -0.89 | | -0.45 | -1.28 |
| MTG | | 10/13/14 | 11/03/14 | 21 | 23.13 | 24.30 | 21.95 | -1.18 | -5.09 | | -2.54 | -2.54 |
| Nordea Bank | | 4/11/16 | 4/18/16 | 7 | 8.31 | 8.48 | 8.15 | -0.17 | -2.02 | | -1.01 | |
| | | 6/27/16 | 7/11/16 | 14 | 7.19 | 7.50 | 6.89 | -0.31 | -4.25 | | -2.13 | -3.12 |
| Autoliv | | 6/03/19 | 6/10/19 | 7 | 55.99 | 60.78 | 51.20 | -4.79 | -8.56 | | -4.28 | -4.28 |
| ABB | | 5/14/12 | 7/23/12 | 70 | 12.97 | 14.17 | 11.77 | -1.20 | -9.26 | | -4.63 | -4.63 |
| Electrolux | | 10/29/18 | 2/04/19 | 98 | 17.40 | 22.97 | 11.83 | -5.57 | -32.00 | | -16.00 | |
| | | 3/02/20 | 6/22/20 | 112 | 18.22 | 14.68 | 22.61 | 4.39 | 24.11 | | 12.06 | -5.87 |
| SBB | | 6/26/23 | 7/03/23 | 7 | 0.30 | 0.35 | 0.24 | -0.05 | -18.43 | | -9.21 | |
| | | 8/21/23 | 9/04/23 | 14 | 0.28 | 0.30 | 0.25 | -0.02 | -8.41 | | -4.20 | |
| | | 9/11/23 | 11/27/23 | 77 | 0.30 | 0.34 | 0.26 | -0.04 | -13.59 | | -6.80 | -18.94 |
Annotations
| 5/13/22 | Atlas Copco B | | | splits 1:4 (four for one) |
| | Atlas Copco A | | | splits 1:4 (four for one) |
| 5/19/21 | Hexagon | | | stock split 1:7 (seven for one) |
| | Investor | | | stock split 1:4 (four for one) |
| 7/26/18 | OMXS 30 | | | Hexagon replaces Fingerprint Cards |
| 6/29/18 | Autoliv | | | spin-off of Veoneer |
| 6/19/18 | Atlas Copco A | | | spin-off Epiroc |
| 1/02/18 | OMXS 30 | | | Lundin drops out as a consequence of the SCA Essity split |
| 1/02/17 | OMXS 30 | | | Autoliv replaces Nokia |
| 1/04/16 | OMXS 30 | | | Fingerprint Cards replaces MTG |
| 9/10/15 | OMXS 30 | | | complete analysis |
| | OMXS 30 | | | complete analysis |
| 6/03/15 | Assa Abloy | | | ex split 1:3 (three for one) |
| 5/19/15 | Svenska Handelsbank | | | ex Split 1:3 (three for one) |
|
|