| | Mon, 29th Jun 2026, 14:40UTC |
| | |

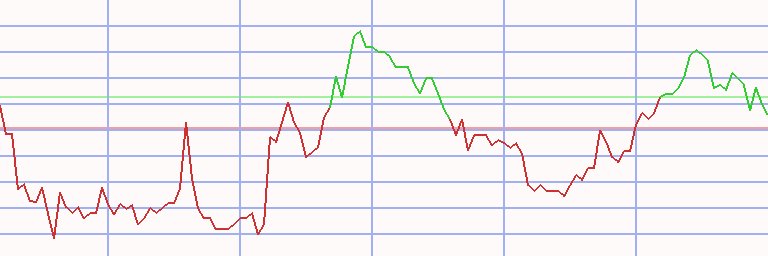
Assessment - Bayrischer Aktienindex in Euro - 1/07/24 - RS = 22
⇐
| |
|
instrument |
freshest |
⇓ Δday |
1/07/24 |
⇓ Δwk |
29/01/24 |
prc diff |
⇓ Δ22 |
|
⇓∅-RS |
| |  |
 |
 |
|
|
 |
BAX |
801.962 |
12/08/24 |
-0.03 |
842.566 |
-4.82 |
808.793 |
33.773 |
4.18 |
|
5.86 |
| | |
|
|
|
|
|
7C Solarparken |
2.285 |
12/08/24 |
0.88 |
2.755 |
-17.06 |
3.355 |
-0.600 |
-17.88 |
|
-10.60 |
| | |
|
|
|
|
|
Adidas |
212.400 |
12/08/24 |
-1.03 |
219.500 |
-3.23 |
178.000 |
41.500 |
23.31 |
|
17.93 |
| | |
|
|
|
|
|
Adtran Networks |
19.100 |
12/08/24 |
|
19.340 |
-1.24 |
20.000 |
-0.660 |
-3.30 |
|
-0.70 |
| | |
|
|
|
|
|
Allianz |
255.900 |
12/08/24 |
|
262.500 |
-2.51 |
246.550 |
15.950 |
6.47 |
|
7.44 |
| | |
|
|
|
|
|
Atoss |
135.800 |
12/08/24 |
0.74 |
110.600 |
22.78 |
121.750 |
-11.150 |
-9.16 |
|
1.25 |
| | |
|
|
|
L |
|
AUTO1 |
8.125 |
12/08/24 |
0.18 |
6.350 |
27.95 |
3.911 |
2.439 |
62.36 |
|
13.81 |
| | |
|
|
|
S |
|
BMW |
78.980 |
12/08/24 |
-0.90 |
89.140 |
-11.40 |
94.910 |
-5.770 |
-6.08 |
|
-12.27 |
| | |
|
|
|
S |
|
BayWa |
13.800 |
12/08/24 |
0.44 |
20.100 |
-31.34 |
30.450 |
-10.350 |
-33.99 |
|
-29.58 |
| | |
|
|
|
L |
|
Cancom |
30.360 |
12/08/24 |
-0.52 |
32.660 |
-7.04 |
29.660 |
3.000 |
10.11 |
|
13.52 |
| | |
|
|
|
|
|
CTS Eventim |
77.000 |
12/08/24 |
-0.32 |
77.400 |
-0.52 |
60.950 |
16.450 |
26.99 |
|
21.89 |
| | |
|
|
|
L |
|
Dermapharm |
35.150 |
12/08/24 |
0.29 |
35.800 |
-1.82 |
38.960 |
-3.160 |
-8.11 |
|
-7.56 |
| | |
|
|
|
L |
|
Deutsche Pfandbrief |
4.944 |
12/08/24 |
0.20 |
5.155 |
-4.09 |
5.690 |
-0.535 |
-9.40 |
|
-4.51 |
| | |
|
|
|
|
|
Hensoldt |
34.640 |
12/08/24 |
0.99 |
35.200 |
-1.59 |
27.440 |
7.760 |
28.28 |
|
9.42 |
| | |
|
|
|
L |
|
Infineon |
30.280 |
12/08/24 |
0.36 |
34.365 |
-11.89 |
33.520 |
0.845 |
2.52 |
|
7.08 |
| | |
|
|
|
L |
|
Knaus Tabbert |
32.050 |
12/08/24 |
-1.69 |
39.200 |
-18.24 |
41.000 |
-1.800 |
-4.39 |
|
-1.02 |
| | |
|
|
|
L |
|
Koenig & Bauer |
9.570 |
12/08/24 |
-4.20 |
13.580 |
-29.53 |
11.600 |
1.980 |
17.07 |
|
10.97 |
| | |
|
|
|
|
|
Krones |
117.800 |
12/08/24 |
0.68 |
118.200 |
-0.34 |
116.300 |
1.900 |
1.63 |
|
8.90 |
| | |
|
|
|
S |
|
Medigene |
1.100 |
12/08/24 |
0.46 |
1.115 |
-1.35 |
1.410 |
-0.295 |
-20.92 |
|
-23.51 |
| | |
|
|
|
|
|
Morphosys |
67.250 |
2/08/24 |
|
67.600 |
-0.52 |
39.230 |
28.370 |
72.32 |
|
86.20 |
| | |
|
|
|
|
|
MTU Aero Engines |
258.600 |
12/08/24 |
0.23 |
236.600 |
9.30 |
221.200 |
15.400 |
6.96 |
|
9.60 |
| | |
|
|
|
L |
|
Münchener Rück |
439.200 |
12/08/24 |
1.01 |
466.900 |
-5.93 |
395.500 |
71.400 |
18.05 |
|
18.31 |
| | |
|
|
|
|
|
Mutares |
31.250 |
12/08/24 |
0.16 |
34.900 |
-10.46 |
36.450 |
-1.550 |
-4.25 |
|
14.45 |
| | |
|
|
|
|
|
Nemetschek |
87.400 |
12/08/24 |
0.52 |
92.350 |
-5.36 |
84.560 |
7.790 |
9.21 |
|
20.89 |
| | |
|
|
|
|
|
Patrizia Immobilien |
7.150 |
12/08/24 |
1.27 |
7.070 |
1.13 |
7.690 |
-0.620 |
-8.06 |
|
-6.31 |
| |
|
instrument |
freshest |
⇓ Δday |
1/07/24 |
⇓ Δwk |
29/01/24 |
prc diff |
⇓ Δ22 |
|
⇓∅-RS |
| | |
|
|
|
|
|
Pro7-Sat1 |
5.820 |
12/08/24 |
0.17 |
6.690 |
-13.00 |
6.104 |
0.586 |
9.60 |
|
3.13 |
| | |
|
|
|
L |
|
Puma |
34.810 |
12/08/24 |
-0.29 |
43.690 |
-20.33 |
38.000 |
5.690 |
14.97 |
|
-9.25 |
| | |
|
|
|
|
|
Rational |
866.500 |
12/08/24 |
1.40 |
771.000 |
12.39 |
720.500 |
50.500 |
7.01 |
|
17.09 |
| | |
|
|
|
S |
|
Schaeffler |
4.646 |
12/08/24 |
0.17 |
5.345 |
-13.08 |
5.850 |
-0.505 |
-8.63 |
|
-2.90 |
| | |
|
|
|
|
|
Scout24 |
68.550 |
12/08/24 |
0.51 |
70.850 |
-3.25 |
67.560 |
3.290 |
4.87 |
|
7.29 |
| | |
|
|
|
L |
|
SFC Energy |
19.620 |
12/08/24 |
-0.71 |
19.740 |
-0.61 |
18.180 |
1.560 |
8.58 |
|
9.18 |
| | |
|
|
|
|
|
Siemens |
157.200 |
12/08/24 |
0.01 |
177.120 |
-11.25 |
167.340 |
9.780 |
5.84 |
|
7.94 |
| | |
|
|
|
L |
|
Siemens Energy |
24.250 |
12/08/24 |
0.25 |
24.160 |
0.37 |
13.755 |
10.405 |
75.65 |
|
67.67 |
| | |
|
|
|
|
|
Siemens Healthineers |
50.280 |
12/08/24 |
0.08 |
53.840 |
-6.61 |
52.260 |
1.580 |
3.02 |
|
2.97 |
| | |
|
|
|
S |
|
Siltronic |
73.500 |
12/08/24 |
0.75 |
72.800 |
0.96 |
87.650 |
-14.850 |
-16.94 |
|
-6.97 |
| | |
|
|
|
S |
|
Sixt |
60.750 |
12/08/24 |
-2.49 |
66.400 |
-8.51 |
92.200 |
-25.800 |
-27.98 |
|
-25.47 |
| | |
|
|
|
L |
|
Steico |
26.850 |
12/08/24 |
0.56 |
29.000 |
-7.41 |
29.600 |
-0.600 |
-2.03 |
|
9.83 |
| | |
|
|
|
|
|
Stemmer Imaging |
48.100 |
12/08/24 |
-0.21 |
34.700 |
38.62 |
32.400 |
2.300 |
7.10 |
|
0.13 |
| | |
|
|
|
|
|
Synlab |
11.060 |
12/08/24 |
1.10 |
11.200 |
-1.25 |
11.740 |
-0.540 |
-4.60 |
|
8.07 |
| | |
|
|
|
|
|
Traton |
26.700 |
12/08/24 |
|
30.700 |
-13.03 |
22.580 |
8.120 |
35.96 |
|
32.61 |
| | |
|
|
|
L |
|
Umweltbank |
5.640 |
12/08/24 |
-1.40 |
6.380 |
-11.60 |
7.660 |
-1.280 |
-16.71 |
|
-15.93 |
| | |
|
|
|
S |
|
Vitesco Technologies |
52.050 |
12/08/24 |
-0.10 |
59.850 |
-13.03 |
80.300 |
-20.450 |
-25.47 |
|
-19.51 |
| | |
|
|
|
|
|
Wacker Chemie |
84.060 |
12/08/24 |
-0.33 |
101.650 |
-17.30 |
101.800 |
-0.150 |
-0.15 |
|
-16.31 |
| | |
|
|
|
|
|
Wacker Neuson |
14.040 |
12/08/24 |
-0.28 |
15.100 |
-7.02 |
16.980 |
-1.880 |
-11.07 |
|
-14.56 |
| | |
|
|
|
L |
|
WashTec |
36.400 |
12/08/24 |
-0.27 |
39.100 |
-6.91 |
32.000 |
7.100 |
22.19 |
|
14.72 |
| BAX - 44 out of 43 instruments rated - 1/07/24 / 29/01/24 - 24 did rise, Market-Ratio(22) in EUR = 54.55 % |
| Stock Exchange Currency: EUR € Euro |
Technical Chart
Transactions Bayrischer Aktienindex in Euro * L22 - 62/50 (1)
|
⇐ |
| |
| L/S | date buy | date sell | days | | instrument | spl | pieces | | prc buy | prc sell | | prc diff | d % | asset | yield | |
| 2/01/06 |
23/10/06 |
294 |
|
- cash - |
| long |
23/10/06 |
10/09/07 |
322 |
|
|
|
Wirecard |
100 |
2,272 |
|
4.400 |
7.728 |
|
3.328 |
76 |
17,561 |
89 |
|
| 10/09/07 |
27/04/09 |
595 |
|
- cash - |
| |
27/04/09 |
8/06/09 |
42 |
|
|
|
Steico |
100 |
6,271 |
|
2.800 |
4.250 |
|
1.450 |
52 |
26,654 |
3,658 |
|
| 8/06/09 |
15/06/09 |
7 |
|
- cash - |
| |
15/06/09 |
20/06/11 |
735 |
|
|
|
Pro7-Sat1 |
100 |
6,316 |
|
4.220 |
18.575 |
|
14.355 |
340 |
117,320 |
109 |
|
| 20/06/11 |
25/07/11 |
35 |
|
- cash - |
| |
25/07/11 |
8/08/11 |
14 |
|
|
|
Zooplus |
100 |
2,004 |
|
58.542 |
48.645 |
|
-9.897 |
-17 |
97,487 |
-99 |
|
| 8/08/11 |
9/01/12 |
154 |
|
- cash - |
| |
9/01/12 |
9/07/12 |
182 |
|
|
|
Wirecard |
100 |
7,376 |
|
13.215 |
15.350 |
|
2.135 |
16 |
113,235 |
35 |
|
| 9/07/12 |
5/11/12 |
119 |
|
- cash - |
| |
5/11/12 |
28/07/14 |
630 |
|
|
|
Morphosys |
100 |
4,340 |
|
26.085 |
72.000 |
|
45.915 |
176 |
312,506 |
80 |
|
| 28/07/14 |
5/01/15 |
161 |
|
- cash - |
| |
5/01/15 |
17/08/15 |
224 |
|
|
|
Patrizia Immobilien |
100 |
23,791 |
|
13.135 |
24.300 |
|
11.165 |
85 |
578,132 |
172 |
|
| 17/08/15 |
26/10/15 |
70 |
|
- cash - |
| |
26/10/15 |
11/01/16 |
77 |
|
|
|
Adtran Networks |
100 |
59,113 |
|
9.780 |
10.160 |
|
0.380 |
4 |
600,595 |
20 |
|
| 11/01/16 |
25/01/16 |
14 |
|
- cash - |
| |
25/01/16 |
8/02/16 |
14 |
|
|
|
Koenig & Bauer |
100 |
19,821 |
|
30.300 |
23.835 |
|
-6.465 |
-21 |
472,452 |
-100 |
|
| 8/02/16 |
29/02/16 |
21 |
|
- cash - |
| |
29/02/16 |
28/03/16 |
28 |
|
|
|
Phoenix Solar |
100 |
101,384 |
|
4.660 |
4.500 |
|
-0.160 |
-3 |
456,231 |
-37 |
|
| 28/03/16 |
20/06/16 |
84 |
|
- cash - |
| |
20/06/16 |
27/06/16 |
7 |
|
|
|
Koenig & Bauer |
100 |
9,621 |
|
47.420 |
42.820 |
|
-4.600 |
-10 |
411,974 |
-100 |
|
| 27/06/16 |
11/07/16 |
14 |
|
- cash - |
| |
11/07/16 |
7/11/16 |
119 |
|
|
|
Koenig & Bauer |
100 |
9,403 |
|
43.810 |
42.780 |
|
-1.030 |
-2 |
402,289 |
-7 |
|
| 7/11/16 |
28/11/16 |
21 |
|
- cash - |
| |
28/11/16 |
5/03/18 |
462 |
|
|
|
Siltronic |
100 |
10,937 |
|
36.780 |
120.700 |
|
83.920 |
228 |
1,320,122 |
156 |
|
| 5/03/18 |
7/05/18 |
63 |
|
- cash - |
| |
7/05/18 |
18/06/18 |
42 |
|
|
|
SFC Energy |
100 |
152,439 |
|
8.660 |
7.960 |
|
-0.700 |
-8 |
1,213,415 |
-52 |
|
| 18/06/18 |
6/08/18 |
49 |
|
- cash - |
| |
6/08/18 |
13/08/18 |
7 |
|
|
|
Wirecard |
100 |
7,303 |
|
166.150 |
169.800 |
|
3.650 |
2 |
1,240,071 |
211 |
|
| 13/08/18 |
27/08/18 |
14 |
|
- cash - |
| |
27/08/18 |
10/09/18 |
14 |
|
|
|
Wirecard |
100 |
6,383 |
|
194.250 |
186.250 |
|
-8.000 |
-4 |
1,189,007 |
-67 |
|
| 10/09/18 |
15/04/19 |
217 |
|
- cash - |
| |
15/04/19 |
5/08/19 |
112 |
|
|
|
Adtran Networks |
100 |
124,764 |
|
9.530 |
6.400 |
|
-3.130 |
-33 |
798,496 |
-73 |
|
| 5/08/19 |
4/11/19 |
91 |
|
- cash - |
| |
4/11/19 |
2/03/20 |
119 |
|
|
|
va-Q-tec |
100 |
74,625 |
|
10.700 |
11.050 |
|
0.350 |
3 |
824,614 |
10 |
|
| 2/03/20 |
10/08/20 |
161 |
|
- cash - |
| |
10/08/20 |
2/11/20 |
84 |
|
|
|
va-Q-tec |
100 |
44,573 |
|
18.500 |
25.800 |
|
7.300 |
39 |
1,149,997 |
324 |
|
| 2/11/20 |
16/11/20 |
14 |
|
- cash - |
| |
16/11/20 |
4/10/21 |
322 |
|
|
|
va-Q-tec |
100 |
31,506 |
|
36.500 |
28.100 |
|
-8.400 |
-23 |
885,347 |
-26 |
|
| 4/10/21 |
6/02/23 |
490 |
|
- cash - |
| |
6/02/23 |
26/06/23 |
140 |
|
|
|
va-Q-tec |
100 |
35,916 |
|
24.650 |
26.050 |
|
1.400 |
6 |
935,629 |
15 |
|
| 26/06/23 |
26/02/24 |
245 |
|
- cash - |
| |
26/02/24 |
1/07/24 |
126 |
|
|
|
Morphosys |
100 |
14,372 |
|
65.100 |
67.600 |
|
2.500 |
4 |
971,559 |
12 |
|
| accum | 23/10/06 |
1/07/24 | 4550 |
days out of 7483 invested (61%) |
9,616 |
971,559 |
44 |
|
Instrument Related Contribution
| instrument | L/S | date buy | date sell | days | prc buy | prc sell | | prc diff | d % | | | total |
| Pro7-Sat1 | long | 15/06/09 | 20/06/11 | 735 | 4.22 | 18.58 | | 14.36 | 340.17 | | | 340.17 |
| Siltronic | | 28/11/16 | 5/03/18 | 462 | 36.78 | 120.70 | | 83.92 | 228.17 | | | 228.17 |
| Morphosys | | 5/11/12 | 28/07/14 | 630 | 26.09 | 72.00 | | 45.92 | 176.02 | | | |
| | | 26/02/24 | 1/07/24 | 126 | 65.10 | 67.60 | | 2.50 | 3.84 | | | 186.62 |
| Wirecard | | 23/10/06 | 10/09/07 | 322 | 4.40 | 7.73 | | 3.33 | 75.64 | | | |
| | | 9/01/12 | 9/07/12 | 182 | 13.22 | 15.35 | | 2.14 | 16.16 | | | |
| | | 6/08/18 | 13/08/18 | 7 | 166.15 | 169.80 | | 3.65 | 2.20 | | | |
| | | 27/08/18 | 10/09/18 | 14 | 194.25 | 186.25 | | -8.00 | -4.12 | | | 99.91 |
| Patrizia Immobilien | | 5/01/15 | 17/08/15 | 224 | 13.14 | 24.30 | | 11.17 | 85.00 | | | 85.00 |
| Steico | | 27/04/09 | 8/06/09 | 42 | 2.80 | 4.25 | | 1.45 | 51.79 | | | 51.79 |
| va-Q-tec | | 4/11/19 | 2/03/20 | 119 | 10.70 | 11.05 | | 0.35 | 3.27 | | | |
| | | 10/08/20 | 2/11/20 | 84 | 18.50 | 25.80 | | 7.30 | 39.46 | | | |
| | | 16/11/20 | 4/10/21 | 322 | 36.50 | 28.10 | | -8.40 | -23.01 | | | |
| | | 6/02/23 | 26/06/23 | 140 | 24.65 | 26.05 | | 1.40 | 5.68 | | | 17.17 |
| Phoenix Solar | | 29/02/16 | 28/03/16 | 28 | 4.66 | 4.50 | | -0.16 | -3.43 | | | -3.43 |
| SFC Energy | | 7/05/18 | 18/06/18 | 42 | 8.66 | 7.96 | | -0.70 | -8.08 | | | -8.08 |
| Zooplus | | 25/07/11 | 8/08/11 | 14 | 58.54 | 48.65 | | -9.90 | -16.91 | | | -16.91 |
| Adtran Networks | | 26/10/15 | 11/01/16 | 77 | 9.78 | 10.16 | | 0.38 | 3.89 | | | |
| | | 15/04/19 | 5/08/19 | 112 | 9.53 | 6.40 | | -3.13 | -32.84 | | | -30.23 |
| Koenig & Bauer | | 25/01/16 | 8/02/16 | 14 | 30.30 | 23.84 | | -6.47 | -21.34 | | | |
| | | 20/06/16 | 27/06/16 | 7 | 47.42 | 42.82 | | -4.60 | -9.70 | | | |
| | | 11/07/16 | 7/11/16 | 119 | 43.81 | 42.78 | | -1.03 | -2.35 | | | -30.64 |
Annotations
| 12/08/24 | Morphosys | | | acquired by Novartis |
| 28/06/19 | Nemetschek | | | splits1:3 (three for one) |
| 11/06/19 | Puma | | | splits 1:10 (ten for one) |
| 16/07/18 | Cancom | | | stock split 1:2 (another one for one) |
| 18/09/17 | Umweltbank | | | stock split 1:5 (five for one) |
| 20/03/17 | BAX | | | GFK drops out (acquired by KKR) |
| 16/12/16 | Medigene | | | return |
| 10/10/16 | Chorus | | | acquired by Capital Stage - deletion |
| 4/06/16 | Schaeffler | | | moves from SDAX to MDAX (2016-06-20) |
| 10/03/16 | WashTec | | | recording started (SDAX) |
| 9/03/16 | Pro7-Sat1 | | | moves from MDAX to DAX |
| 8/02/16 | BayX40 | | | complete analysis |
| 21/12/15 | Scout24 | | | entry (SDAX) |
| | Schaeffler | | | entry (SDAX) |
| | Siltronic | | | recording started |
| 4/09/15 | Deutsche Pfandbrief | | | recording started (MDAX) |
| 30/06/15 | Nemetschek | | | stock split 1:4 (four for one) |
| 21/06/15 | Koenig & Bauer | | | returns to SDAX |
| | Adva | | | returns to TecDAX |
| 1/04/15 | CTS Eventim | | | promotion from SDAX to MDAX replacing TUI |
|
|