| | |
| | |

Assessment - Hang Seng Property in Dollar - 7/01/24 - RS = 26
⇐
| |
|
⇓instrument |
freshest |
⇓ Δday |
7/01/24 |
⇓ Δwk |
1/01/24 |
prc diff |
⇓ Δ26 |
|
∅-RS |
| |  |
 |
 |
|
|
 |
HSI-Ppty |
1,896.860 |
8/12/24 |
-1.16 |
1,895.285 |
0.08 |
2,345.979 |
-450.694 |
-19.21 |
|
-15.90 |
| | |
|
|
|
L |
|
China Ov Land & Inv |
1.636 |
8/12/24 |
-0.93 |
1.734 |
-5.61 |
1.761 |
-0.028 |
-1.56 |
|
-2.92 |
| | |
|
|
|
|
|
Henderson Land |
2.823 |
8/12/24 |
-2.43 |
2.683 |
5.25 |
3.078 |
-0.396 |
-12.86 |
|
-5.47 |
| | |
|
|
|
L |
|
Longfor |
1.223 |
8/12/24 |
-1.95 |
1.373 |
-10.91 |
1.600 |
-0.227 |
-14.21 |
|
-12.64 |
| | |
|
|
|
L |
|
China Res Land |
2.913 |
8/12/24 |
-1.09 |
3.400 |
-14.31 |
3.584 |
-0.184 |
-5.14 |
|
-5.14 |
| | |
|
|
|
L |
|
China Res Mixc |
2.798 |
8/12/24 |
-1.13 |
3.310 |
-15.47 |
3.565 |
-0.255 |
-7.15 |
|
-9.44 |
| | |
|
|
|
|
|
Sun Hung Kai |
9.162 |
8/12/24 |
-1.85 |
8.650 |
5.92 |
10.810 |
-2.160 |
-19.98 |
|
-15.68 |
| | |
|
|
|
S |
|
Link REIT |
4.463 |
8/12/24 |
-0.57 |
3.886 |
14.83 |
5.613 |
-1.727 |
-30.76 |
|
-19.67 |
| | |
|
|
|
S |
|
CK Property |
3.963 |
8/12/24 |
0.32 |
3.745 |
5.81 |
5.018 |
-1.272 |
-25.36 |
|
-21.77 |
| | |
|
|
|
|
|
Wharf REIC |
2.759 |
8/12/24 |
-1.60 |
2.651 |
4.11 |
3.379 |
-0.729 |
-21.56 |
|
-24.28 |
| | |
|
|
|
|
|
Country Garden Svcs |
0.601 |
8/12/24 |
-1.47 |
0.617 |
-2.70 |
0.864 |
-0.247 |
-28.57 |
|
-25.78 |
| | |
|
|
|
S |
|
Hang Lung |
0.716 |
8/12/24 |
-1.41 |
0.853 |
-16.07 |
1.393 |
-0.540 |
-38.77 |
|
-30.16 |
| | |
|
|
|
|
|
New World Dev |
0.927 |
8/12/24 |
-2.69 |
0.936 |
-0.96 |
1.551 |
-0.615 |
-39.67 |
|
-36.39 |
| HSI-Prop - 12 out of 12 instruments rated - 7/01/24 / 1/01/24 - 0 did rise, Market-Ratio(26) in USD = 0.00 % |
| Stock Exchange Currency: HKD $ Hong Kong dollar |
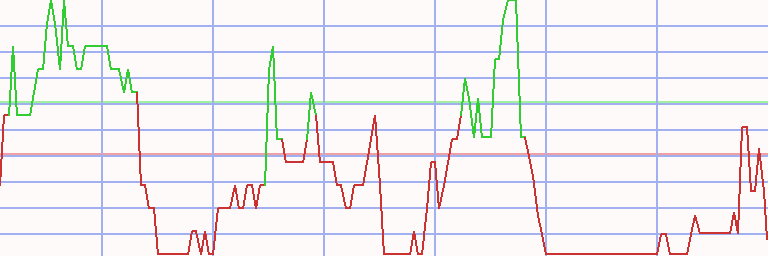
Technical Chart
Transactions Hang Seng Property in Dollar * 26 - 60/40 (2)
|
⇐ |
| |
| L/S | date buy | date sell | days | | instrument | spl | pieces | | prc buy | prc sell | ps short | prc diff | d % | asset | yield | |
| 1/02/06 |
3/03/08 |
791 |
|
- cash - |
| short |
3/03/08 |
3/30/09 |
392 |
|
|
|
CK Hutchison |
50 |
382 |
|
13.080 |
9.205 |
18.585 |
5.505 |
42 |
12,103 |
39 |
|
| |
|
|
|
|
|
|
Sino Land |
50 |
2,247 |
|
2.226 |
1.148 |
4.315 |
2.089 |
94 |
16,796 |
85 |
|
| 100 |
68 |
62 | |
| long |
3/30/09 |
1/25/10 |
301 |
|
|
|
China Ov Land & Inv |
50 |
4,987 |
|
1.684 |
1.781 |
|
0.097 |
6 |
17,280 |
7 |
|
| |
|
|
|
|
|
|
China Res Land |
50 |
4,825 |
|
1.741 |
1.814 |
|
0.073 |
4 |
17,634 |
5 |
|
| 100 |
5 |
6 | |
| short |
1/25/10 |
3/01/10 |
35 |
|
|
|
CK Hutchison |
50 |
732 |
|
12.037 |
12.476 |
11.597 |
-0.439 |
-4 |
17,313 |
-32 |
|
| |
|
|
|
|
|
|
China Ov Land & Inv |
50 |
4,955 |
|
1.781 |
2.119 |
1.442 |
-0.339 |
-19 |
15,636 |
-89 |
|
| 100 |
-11 |
-71 | |
| long |
3/01/10 |
4/19/10 |
49 |
|
|
|
Henderson Land |
50 |
1,118 |
|
6.991 |
6.735 |
|
-0.256 |
-4 |
15,350 |
-24 |
|
| |
|
|
|
|
|
|
Sino Land |
50 |
4,043 |
|
1.934 |
1.935 |
|
0.002 |
0 |
15,356 |
1 |
|
| 100 |
-2 |
-13 | |
| short |
4/19/10 |
7/19/10 |
91 |
|
|
|
China Ov Land & Inv |
50 |
3,993 |
|
1.922 |
2.123 |
1.722 |
-0.201 |
-10 |
14,555 |
-36 |
|
| |
|
|
|
|
|
|
China Res Land |
50 |
4,197 |
|
1.830 |
2.133 |
1.526 |
-0.304 |
-17 |
13,280 |
-52 |
|
| 100 |
-14 |
-44 | |
| long |
7/19/10 |
2/07/11 |
203 |
|
|
|
Hang Lung |
50 |
1,567 |
|
4.236 |
4.057 |
|
-0.179 |
-4 |
13,000 |
-7 |
|
| |
|
|
|
|
|
|
Sun Hung Kai |
50 |
454 |
|
14.620 |
15.807 |
|
1.187 |
8 |
13,539 |
15 |
|
| 100 |
2 |
4 | |
| short |
2/07/11 |
2/13/12 |
371 |
|
|
|
China Ov Land & Inv |
50 |
3,988 |
|
1.697 |
1.880 |
1.514 |
-0.183 |
-11 |
12,810 |
-11 |
|
| |
|
|
|
|
|
|
China Res Land |
50 |
4,158 |
|
1.628 |
1.906 |
1.350 |
-0.278 |
-17 |
11,654 |
-17 |
|
| 100 |
-14 |
-14 | |
| long |
2/13/12 |
5/27/13 |
469 |
|
|
|
Sino Land |
50 |
3,530 |
|
1.650 |
1.512 |
|
-0.139 |
-8 |
11,165 |
-7 |
|
| |
|
|
|
|
|
|
China Res Land |
50 |
3,058 |
|
1.906 |
3.033 |
|
1.127 |
59 |
14,611 |
44 |
|
| 100 |
25 |
19 | |
| L/S | date buy | date sell | days | | instrument | spl | pieces | | prc buy | prc sell | ps short | prc diff | d % | asset | yield | | | short |
5/27/13 |
7/28/14 |
427 |
|
|
|
Hang Lung |
50 |
2,040 |
|
3.580 |
3.019 |
4.245 |
0.665 |
19 |
15,967 |
16 |
|
| |
|
|
|
|
|
|
Sino Land |
50 |
4,833 |
|
1.512 |
1.683 |
1.341 |
-0.171 |
-11 |
15,142 |
-10 |
|
| 100 |
4 |
3 | |
| long |
7/28/14 |
3/09/15 |
224 |
|
|
|
CK Hutchison |
50 |
410 |
|
18.452 |
19.654 |
|
1.203 |
7 |
15,635 |
11 |
|
| |
|
|
|
|
|
|
Sino Land |
50 |
4,502 |
|
1.683 |
1.557 |
|
-0.126 |
-7 |
15,069 |
-12 |
|
| 100 |
0 |
-1 | |
| short |
3/09/15 |
3/30/15 |
21 |
|
|
|
Hang Lung |
50 |
2,675 |
|
2.816 |
2.766 |
2.867 |
0.051 |
2 |
15,206 |
37 |
|
| |
|
|
|
|
|
|
The Wharf |
50 |
2,850 |
|
2.644 |
2.618 |
2.670 |
0.026 |
1 |
15,280 |
18 |
|
| 100 |
1 |
27 | |
| long |
3/30/15 |
7/27/15 |
119 |
|
|
|
China Ov Land & Inv |
50 |
2,279 |
|
3.352 |
3.258 |
|
-0.094 |
-3 |
15,065 |
-8 |
|
| |
|
|
|
|
|
|
China Res Land |
50 |
2,669 |
|
2.862 |
2.839 |
|
-0.024 |
-1 |
15,002 |
-3 |
|
| 100 |
-2 |
-5 | |
| short |
7/27/15 |
7/11/16 |
350 |
|
|
|
Sino Land |
50 |
4,868 |
|
1.541 |
1.668 |
1.414 |
-0.127 |
-8 |
14,384 |
-9 |
|
| |
|
|
|
|
|
|
The Wharf |
50 |
3,083 |
|
2.433 |
2.297 |
2.577 |
0.144 |
6 |
14,829 |
6 |
|
| 100 |
-1 |
-1 | |
| long |
7/11/16 |
1/16/17 |
189 |
|
|
|
Sino Land |
50 |
4,445 |
|
1.668 |
1.633 |
|
-0.035 |
-2 |
14,673 |
-4 |
|
| |
|
|
|
|
|
|
Link REIT |
50 |
1,061 |
|
6.986 |
6.713 |
|
-0.273 |
-4 |
14,383 |
-7 |
|
| 100 |
-3 |
-6 | |
| short |
1/16/17 |
4/17/17 |
91 |
|
|
|
China Ov Land & Inv |
50 |
2,472 |
|
2.908 |
2.998 |
2.818 |
-0.090 |
-3 |
14,162 |
-12 |
|
| |
|
|
|
|
|
|
Henderson Land |
50 |
1,300 |
|
5.533 |
6.440 |
4.626 |
-0.907 |
-16 |
12,982 |
-51 |
|
| 100 |
-10 |
-34 | |
| long |
4/17/17 |
4/16/18 |
364 |
|
|
|
Hang Lung |
50 |
2,431 |
|
2.670 |
2.325 |
|
-0.344 |
-13 |
12,145 |
-13 |
|
| |
|
|
|
|
|
|
The Wharf |
50 |
1,988 |
|
3.264 |
3.355 |
|
0.091 |
3 |
12,326 |
3 |
|
| 100 |
-5 |
-5 | |
| L/S | date buy | date sell | days | | instrument | spl | pieces | | prc buy | prc sell | ps short | prc diff | d % | asset | yield | | | short |
4/16/18 |
5/14/18 |
28 |
|
|
|
Hang Lung |
50 |
2,650 |
|
2.325 |
2.410 |
2.241 |
-0.084 |
-4 |
12,102 |
-38 |
|
| |
|
|
|
|
|
|
Sino Land |
50 |
3,706 |
|
1.663 |
1.737 |
1.589 |
-0.074 |
-4 |
11,827 |
-45 |
|
| 100 |
-4 |
-42 | |
| long |
5/14/18 |
6/25/18 |
42 |
|
|
|
China Res Land |
50 |
1,532 |
|
3.859 |
3.378 |
|
-0.481 |
-12 |
11,090 |
-69 |
|
| |
|
|
|
|
|
|
New World Dev |
50 |
966 |
|
6.124 |
5.670 |
|
-0.454 |
-7 |
10,652 |
-49 |
|
| 100 |
-10 |
-60 | |
| short |
6/25/18 |
1/14/19 |
203 |
|
|
|
Hang Lung |
50 |
2,526 |
|
2.108 |
1.969 |
2.257 |
0.149 |
7 |
11,028 |
13 |
|
| |
|
|
|
|
|
|
Henderson Land |
50 |
987 |
|
5.392 |
5.408 |
5.376 |
-0.016 |
0 |
11,012 |
-1 |
|
| 100 |
3 |
6 | |
| long |
1/14/19 |
7/29/19 |
196 |
|
|
|
China Res Land |
50 |
1,397 |
|
3.941 |
4.342 |
|
0.400 |
10 |
11,572 |
20 |
|
| |
|
|
|
|
|
|
Link REIT |
50 |
540 |
|
10.191 |
11.810 |
|
1.619 |
16 |
12,446 |
32 |
|
| 100 |
13 |
26 | |
| short |
7/29/19 |
9/21/20 |
420 |
|
|
|
Sino Land |
50 |
3,789 |
|
1.642 |
1.186 |
2.273 |
0.631 |
38 |
14,837 |
33 |
|
| |
|
|
|
|
|
|
Wharf REIC |
50 |
1,005 |
|
6.190 |
4.131 |
9.275 |
3.086 |
50 |
17,938 |
42 |
|
| 100 |
44 |
37 | |
| long |
9/21/20 |
10/05/20 |
14 |
|
|
|
Hang Lung |
50 |
3,439 |
|
2.607 |
2.646 |
|
0.039 |
1 |
18,072 |
47 |
|
| |
|
|
|
|
|
|
China Res Land |
50 |
1,954 |
|
4.589 |
4.480 |
|
-0.109 |
-2 |
17,859 |
-47 |
|
| 100 |
0 |
-11 | |
| short |
10/05/20 |
11/16/20 |
42 |
|
|
|
China Ov Land & Inv |
50 |
3,576 |
|
2.497 |
2.542 |
2.452 |
-0.045 |
-2 |
17,697 |
-15 |
|
| |
|
|
|
|
|
|
CK Property |
50 |
1,818 |
|
4.912 |
5.374 |
4.450 |
-0.462 |
-9 |
16,857 |
-58 |
|
| 100 |
-6 |
-39 | |
| long |
11/16/20 |
1/04/21 |
49 |
|
|
|
Hang Lung |
50 |
3,202 |
|
2.632 |
2.605 |
|
-0.027 |
-1 |
16,771 |
-7 |
|
| |
|
|
|
|
|
|
Wharf REIC |
50 |
1,710 |
|
4.929 |
5.294 |
|
0.366 |
7 |
17,397 |
70 |
|
| 100 |
3 |
26 | |
| L/S | date buy | date sell | days | | instrument | spl | pieces | | prc buy | prc sell | ps short | prc diff | d % | asset | yield | | | short |
1/04/21 |
1/25/21 |
21 |
|
|
|
China Ov Land & Inv |
50 |
4,087 |
|
2.128 |
2.385 |
1.871 |
-0.257 |
-12 |
16,346 |
-89 |
|
| |
|
|
|
|
|
|
CK Property |
50 |
1,677 |
|
5.185 |
5.195 |
5.175 |
-0.010 |
0 |
16,330 |
-3 |
|
| 100 |
-6 |
-67 | |
| long |
1/25/21 |
8/23/21 |
210 |
|
|
|
Hang Lung |
50 |
3,056 |
|
2.672 |
2.544 |
|
-0.127 |
-5 |
15,941 |
-8 |
|
| |
|
|
|
|
|
|
Wharf REIC |
50 |
1,531 |
|
5.330 |
4.930 |
|
-0.401 |
-8 |
15,327 |
-13 |
|
| 100 |
-6 |
-10 | |
| short |
8/23/21 |
3/21/22 |
210 |
|
|
|
China Res Land |
50 |
2,215 |
|
3.460 |
4.589 |
2.330 |
-1.129 |
-33 |
12,825 |
-50 |
|
| |
|
|
|
|
|
|
Country Garden |
50 |
7,289 |
|
1.051 |
0.675 |
1.638 |
0.586 |
56 |
17,099 |
116 |
|
| 100 |
12 |
21 | |
| long |
3/21/22 |
4/18/22 |
28 |
|
|
|
China Ov Land & Inv |
50 |
2,920 |
|
2.927 |
3.464 |
|
0.536 |
18 |
18,665 |
796 |
|
| |
|
|
|
|
|
|
China Res Land |
50 |
1,863 |
|
4.589 |
5.020 |
|
0.431 |
9 |
19,468 |
222 |
|
| 100 |
14 |
443 | |
| short |
4/18/22 |
5/30/22 |
42 |
|
|
|
Sun Hung Kai |
50 |
803 |
|
12.120 |
12.382 |
11.858 |
-0.262 |
-2 |
19,258 |
-17 |
|
| |
|
|
|
|
|
|
Country Garden |
50 |
12,408 |
|
0.785 |
0.604 |
1.019 |
0.234 |
30 |
22,166 |
869 |
|
| 100 |
14 |
209 | |
| long |
5/30/22 |
6/13/22 |
14 |
|
|
|
China Ov Land & Inv |
50 |
3,797 |
|
2.919 |
2.740 |
|
-0.179 |
-6 |
21,486 |
-81 |
|
| |
|
|
|
|
|
|
Sino Land |
50 |
7,695 |
|
1.440 |
1.427 |
|
-0.013 |
-1 |
21,386 |
-21 |
|
| 100 |
-4 |
-61 | |
| short |
6/13/22 |
2/13/23 |
245 |
|
|
|
Hang Lung |
50 |
5,787 |
|
1.848 |
1.993 |
1.702 |
-0.146 |
-8 |
20,543 |
-12 |
|
| |
|
|
|
|
|
|
Country Garden |
50 |
19,653 |
|
0.544 |
0.343 |
0.864 |
0.319 |
59 |
26,820 |
99 |
|
| 100 |
25 |
40 | |
| long |
2/13/23 |
5/29/23 |
105 |
|
|
|
Sun Hung Kai |
50 |
964 |
|
13.905 |
12.970 |
|
-0.935 |
-7 |
25,919 |
-21 |
|
| |
|
|
|
|
|
|
China Res Mixc |
50 |
2,470 |
|
5.429 |
4.645 |
|
-0.784 |
-14 |
23,981 |
-42 |
|
| 100 |
-11 |
-32 | |
| L/S | date buy | date sell | days | | instrument | spl | pieces | | prc buy | prc sell | ps short | prc diff | d % | asset | yield | | | short |
5/29/23 |
4/01/24 |
308 |
|
|
|
Country Garden |
50 |
63,831 |
|
0.188 |
0.062 |
0.569 |
0.381 |
203 |
48,317 |
272 |
|
| |
|
8/12/24 |
441 |
|
|
|
Country Garden Svcs |
50 |
10,334 |
|
1.160 |
0.601 |
2.242 |
1.081 |
93 |
59,492 |
72 |
|
| 100 |
148 |
112 | |
| accum | 3/03/08 |
8/12/24 | 6341 |
days out of 7132 invested (89%) |
495 |
59,492 |
11 |
|
Instrument Related Contribution
| instrument | L/S | date buy | date sell | days | prc buy | prc sell | ps short | prc diff | d % | spl | di % | total |
| Country Garden | short | 8/23/21 | 3/21/22 | 210 | 1.05 | 0.67 | 1.64 | 0.59 | 55.77 | 50 | 27.88 | |
| | short | 4/18/22 | 5/30/22 | 42 | 0.78 | 0.60 | 1.02 | 0.23 | 29.87 | | 14.94 | |
| | short | 6/13/22 | 2/13/23 | 245 | 0.54 | 0.34 | 0.86 | 0.32 | 58.70 | | 29.35 | |
| | short | 5/29/23 | 4/01/24 | 308 | 0.19 | 0.06 | 0.57 | 0.38 | 202.96 | | 101.48 | 283.07 |
| Country Garden Svcs | short | 5/29/23 | 8/12/24 | 441 | 1.16 | 0.60 | 2.24 | 1.08 | 93.20 | | 46.60 | 46.60 |
| Sino Land | short | 3/03/08 | 3/30/09 | 392 | 2.23 | 1.15 | 4.31 | 2.09 | 93.83 | | 46.92 | |
| | long | 3/01/10 | 4/19/10 | 49 | 1.93 | 1.94 | | 0.00 | 0.08 | | 0.04 | |
| | long | 2/13/12 | 5/27/13 | 469 | 1.65 | 1.51 | | -0.14 | -8.40 | | -4.20 | |
| | short | 5/27/13 | 7/28/14 | 427 | 1.51 | 1.68 | 1.34 | -0.17 | -11.29 | | -5.65 | |
| | long | 7/28/14 | 3/09/15 | 224 | 1.68 | 1.56 | | -0.13 | -7.47 | | -3.74 | |
| | short | 7/27/15 | 7/11/16 | 350 | 1.54 | 1.67 | 1.41 | -0.13 | -8.25 | | -4.12 | |
| | long | 7/11/16 | 1/16/17 | 189 | 1.67 | 1.63 | | -0.04 | -2.10 | | -1.05 | |
| | short | 4/16/18 | 5/14/18 | 28 | 1.66 | 1.74 | 1.59 | -0.07 | -4.46 | | -2.23 | |
| | short | 7/29/19 | 9/21/20 | 420 | 1.64 | 1.19 | 2.27 | 0.63 | 38.42 | | 19.21 | |
| | long | 5/30/22 | 6/13/22 | 14 | 1.44 | 1.43 | | -0.01 | -0.91 | | -0.45 | 40.77 |
| Wharf REIC | short | 7/29/19 | 9/21/20 | 420 | 6.19 | 4.13 | 9.28 | 3.09 | 49.85 | | 24.92 | |
| | long | 11/16/20 | 1/04/21 | 49 | 4.93 | 5.29 | | 0.37 | 7.42 | | 3.71 | |
| | long | 1/25/21 | 8/23/21 | 210 | 5.33 | 4.93 | | -0.40 | -7.52 | | -3.76 | 24.69 |
| CK Hutchison | short | 3/03/08 | 3/30/09 | 392 | 13.08 | 9.21 | 18.59 | 5.51 | 42.09 | | 21.05 | |
| | short | 1/25/10 | 3/01/10 | 35 | 12.04 | 12.48 | 11.60 | -0.44 | -3.65 | | -1.82 | |
| | long | 7/28/14 | 3/09/15 | 224 | 18.45 | 19.65 | | 1.20 | 6.52 | | 3.26 | 22.71 |
| Link REIT | long | 7/11/16 | 1/16/17 | 189 | 6.99 | 6.71 | | -0.27 | -3.91 | | -1.95 | |
| | long | 1/14/19 | 7/29/19 | 196 | 10.19 | 11.81 | | 1.62 | 15.89 | | 7.94 | 5.83 |
| The Wharf | short | 3/09/15 | 3/30/15 | 21 | 2.64 | 2.62 | 2.67 | 0.03 | 0.98 | | 0.49 | |
| | short | 7/27/15 | 7/11/16 | 350 | 2.43 | 2.30 | 2.58 | 0.14 | 5.94 | | 2.97 | |
| | long | 4/17/17 | 4/16/18 | 364 | 3.26 | 3.36 | | 0.09 | 2.79 | | 1.40 | 4.92 |
| instrument | L/S | date buy | date sell | days | prc buy | prc sell | ps short | prc diff | d % | spl | di % | total |
| Sun Hung Kai | long | 7/19/10 | 2/07/11 | 203 | 14.62 | 15.81 | | 1.19 | 8.12 | | 4.06 | |
| | short | 4/18/22 | 5/30/22 | 42 | 12.12 | 12.38 | 11.86 | -0.26 | -2.16 | | -1.08 | |
| | long | 2/13/23 | 5/29/23 | 105 | 13.91 | 12.97 | | -0.93 | -6.72 | | -3.36 | -0.53 |
| Hang Lung | long | 7/19/10 | 2/07/11 | 203 | 4.24 | 4.06 | | -0.18 | -4.22 | | -2.11 | |
| | short | 5/27/13 | 7/28/14 | 427 | 3.58 | 3.02 | 4.24 | 0.66 | 18.57 | | 9.28 | |
| | short | 3/09/15 | 3/30/15 | 21 | 2.82 | 2.77 | 2.87 | 0.05 | 1.82 | | 0.91 | |
| | long | 4/17/17 | 4/16/18 | 364 | 2.67 | 2.33 | | -0.34 | -12.90 | | -6.45 | |
| | short | 4/16/18 | 5/14/18 | 28 | 2.33 | 2.41 | 2.24 | -0.08 | -3.63 | | -1.82 | |
| | short | 6/25/18 | 1/14/19 | 203 | 2.11 | 1.97 | 2.26 | 0.15 | 7.06 | | 3.53 | |
| | long | 9/21/20 | 10/05/20 | 14 | 2.61 | 2.65 | | 0.04 | 1.50 | | 0.75 | |
| | long | 11/16/20 | 1/04/21 | 49 | 2.63 | 2.61 | | -0.03 | -1.02 | | -0.51 | |
| | long | 1/25/21 | 8/23/21 | 210 | 2.67 | 2.54 | | -0.13 | -4.76 | | -2.38 | |
| | short | 6/13/22 | 2/13/23 | 245 | 1.85 | 1.99 | 1.70 | -0.15 | -7.88 | | -3.94 | -3.51 |
| New World Dev | long | 5/14/18 | 6/25/18 | 42 | 6.12 | 5.67 | | -0.45 | -7.41 | | -3.70 | -3.70 |
| CK Property | short | 10/05/20 | 11/16/20 | 42 | 4.91 | 5.37 | 4.45 | -0.46 | -9.40 | | -4.70 | |
| | short | 1/04/21 | 1/25/21 | 21 | 5.18 | 5.19 | 5.17 | -0.01 | -0.19 | | -0.10 | -4.79 |
| China Res Land | long | 3/30/09 | 1/25/10 | 301 | 1.74 | 1.81 | | 0.07 | 4.22 | | 2.11 | |
| | short | 4/19/10 | 7/19/10 | 91 | 1.83 | 2.13 | 1.53 | -0.30 | -16.60 | | -8.30 | |
| | short | 2/07/11 | 2/13/12 | 371 | 1.63 | 1.91 | 1.35 | -0.28 | -17.07 | | -8.53 | |
| | long | 2/13/12 | 5/27/13 | 469 | 1.91 | 3.03 | | 1.13 | 59.13 | | 29.56 | |
| | long | 3/30/15 | 7/27/15 | 119 | 2.86 | 2.84 | | -0.02 | -0.83 | | -0.41 | |
| | long | 5/14/18 | 6/25/18 | 42 | 3.86 | 3.38 | | -0.48 | -12.47 | | -6.23 | |
| | long | 1/14/19 | 7/29/19 | 196 | 3.94 | 4.34 | | 0.40 | 10.16 | | 5.08 | |
| | long | 9/21/20 | 10/05/20 | 14 | 4.59 | 4.48 | | -0.11 | -2.38 | | -1.19 | |
| | short | 8/23/21 | 3/21/22 | 210 | 3.46 | 4.59 | 2.33 | -1.13 | -32.65 | | -16.32 | |
| | long | 3/21/22 | 4/18/22 | 28 | 4.59 | 5.02 | | 0.43 | 9.39 | | 4.70 | -5.75 |
| instrument | L/S | date buy | date sell | days | prc buy | prc sell | ps short | prc diff | d % | spl | di % | total |
| China Res Mixc | long | 2/13/23 | 5/29/23 | 105 | 5.43 | 4.64 | | -0.78 | -14.45 | | -7.22 | -7.22 |
| Henderson Land | long | 3/01/10 | 4/19/10 | 49 | 6.99 | 6.74 | | -0.26 | -3.66 | | -1.83 | |
| | short | 1/16/17 | 4/17/17 | 91 | 5.53 | 6.44 | 4.63 | -0.91 | -16.39 | | -8.20 | |
| | short | 6/25/18 | 1/14/19 | 203 | 5.39 | 5.41 | 5.38 | -0.02 | -0.30 | | -0.15 | -10.01 |
| China Ov Land & Inv | long | 3/30/09 | 1/25/10 | 301 | 1.68 | 1.78 | | 0.10 | 5.76 | | 2.88 | |
| | short | 1/25/10 | 3/01/10 | 35 | 1.78 | 2.12 | 1.44 | -0.34 | -19.01 | | -9.50 | |
| | short | 4/19/10 | 7/19/10 | 91 | 1.92 | 2.12 | 1.72 | -0.20 | -10.43 | | -5.22 | |
| | short | 2/07/11 | 2/13/12 | 371 | 1.70 | 1.88 | 1.51 | -0.18 | -10.77 | | -5.39 | |
| | long | 3/30/15 | 7/27/15 | 119 | 3.35 | 3.26 | | -0.09 | -2.81 | | -1.41 | |
| | short | 1/16/17 | 4/17/17 | 91 | 2.91 | 3.00 | 2.82 | -0.09 | -3.09 | | -1.54 | |
| | short | 10/05/20 | 11/16/20 | 42 | 2.50 | 2.54 | 2.45 | -0.05 | -1.81 | | -0.90 | |
| | short | 1/04/21 | 1/25/21 | 21 | 2.13 | 2.39 | 1.87 | -0.26 | -12.08 | | -6.04 | |
| | long | 3/21/22 | 4/18/22 | 28 | 2.93 | 3.46 | | 0.54 | 18.32 | | 9.16 | |
| | long | 5/30/22 | 6/13/22 | 14 | 2.92 | 2.74 | | -0.18 | -6.13 | | -3.07 | -20.15 |
Annotations
| 3/01/24 | HSI-Prop | | | Component update: Country Garden Holding removed |
|
|