| | |
| | |

Assessment - NAI - Der Natur-Index - 10/10/11 - RS = 11
⇐
| |
|
instrument |
freshest |
⇓ Δday |
10/10/11 |
⇓ Δwk |
7/25/11 |
prc diff |
⇓ Δ11 |
Curr |
⇓∅-RS |
| |  |
 |
 |
|
L |
 |
NAI 30 |
15,522.700 |
8/12/24 |
-0.97 |
3,380.330 |
|
4,324.780 |
-944.450 |
-21.84 |
EUR |
-20.39 |
| | |
|
|
|
|
|
Aixtron |
18.340 |
8/12/24 |
-2.19 |
11.000 |
|
19.665 |
-8.665 |
-44.06 |
EUR |
-51.28 |
| | |
|
|
|
|
|
Aspen Pharmacare |
11.700 |
8/12/24 |
0.86 |
8.250 |
|
8.500 |
-0.250 |
-2.94 |
EUR |
-4.90 |
| | |
|
|
|
|
|
BioNTech |
80.620 |
8/12/24 |
-0.22 |
|
|
|
|
|
USD |
-na- |
| | |
|
|
|
S |
|
EJR |
2,572.000 |
8/09/24 |
-0.87 |
1,544.000 |
|
1,611.670 |
-67.670 |
-4.20 |
JPY |
-4.44 |
| | |
|
|
|
L |
|
First Solar |
219.230 |
8/12/24 |
3.51 |
56.230 |
|
118.230 |
-62.000 |
-52.44 |
USD |
-53.52 |
| | |
|
|
|
L |
|
Geberit |
522.800 |
8/12/24 |
-0.72 |
179.000 |
|
192.200 |
-13.200 |
-6.87 |
CHF |
-6.69 |
| | |
|
|
|
L |
|
Hannon Armstrong SIC |
30.210 |
8/12/24 |
-1.63 |
|
|
|
|
|
USD |
-na- |
| | |
|
|
|
|
|
Interface |
16.310 |
8/12/24 |
-0.79 |
12.850 |
|
18.510 |
-5.660 |
-30.58 |
USD |
-19.68 |
| | |
|
|
|
|
|
Kadant |
290.300 |
8/12/24 |
-1.48 |
18.000 |
|
26.310 |
-8.310 |
-31.58 |
USD |
-23.57 |
| | |
|
|
|
|
|
Kingfisher |
271.400 |
8/12/24 |
0.18 |
258.100 |
|
264.500 |
-6.400 |
-2.42 |
GBP |
2.18 |
| | |
|
|
|
L |
|
Kurita Water |
5,634.000 |
8/09/24 |
-9.14 |
2,130.000 |
|
2,331.000 |
-201.000 |
-8.62 |
JPY |
-6.89 |
| | |
|
|
|
L |
|
Mayr-Melnhof |
103.600 |
8/12/24 |
1.17 |
64.020 |
|
75.310 |
-11.290 |
-14.99 |
EUR |
-18.40 |
| | |
|
|
|
S |
|
Molina Healthcare |
337.670 |
8/12/24 |
-0.15 |
16.110 |
|
22.650 |
-6.540 |
-28.87 |
USD |
-38.18 |
| | |
|
|
|
S |
|
Natura Cosmeticos |
16.380 |
8/12/24 |
-0.91 |
16.530 |
|
17.625 |
-1.095 |
-6.21 |
BRL |
-19.84 |
| | |
|
|
|
L |
|
NVidia |
109.020 |
8/12/24 |
4.08 |
0.370 |
|
0.369 |
0.001 |
0.14 |
USD |
-6.27 |
| | |
|
|
|
L |
|
Ormat Technologies |
71.710 |
8/12/24 |
-1.10 |
19.120 |
|
21.770 |
-2.650 |
-12.17 |
USD |
-17.10 |
| | |
|
|
|
|
|
Pearson |
1,034.500 |
8/12/24 |
-0.72 |
1,159.000 |
|
1,150.000 |
9.000 |
0.78 |
GBP |
8.44 |
| | |
|
|
|
S |
|
Potlatch |
40.860 |
8/12/24 |
-1.99 |
34.480 |
|
33.220 |
1.260 |
3.79 |
USD |
-0.93 |
| | |
|
|
|
|
|
Ricoh |
1,254.500 |
8/09/24 |
2.12 |
622.000 |
|
852.000 |
-230.000 |
-27.00 |
JPY |
-32.82 |
| | |
|
|
|
L |
|
Scatec |
84.600 |
8/12/24 |
-1.46 |
|
|
|
|
|
NOK |
-na- |
| | |
|
|
|
|
|
Signify |
20.900 |
8/12/24 |
-0.76 |
|
|
|
|
|
EUR |
-na- |
| | |
|
|
|
S |
|
Sims Metal Managemt |
9.690 |
8/12/24 |
-2.71 |
13.230 |
|
17.740 |
-4.510 |
-25.42 |
AUD |
-22.31 |
| | |
|
|
|
|
|
Smith and Nephew |
1,156.000 |
8/12/24 |
-0.86 |
584.000 |
|
657.000 |
-73.000 |
-11.11 |
GBP |
-8.74 |
| | |
|
|
|
|
|
Steelcase |
12.290 |
8/12/24 |
-1.76 |
8.050 |
|
9.930 |
-1.880 |
-18.93 |
USD |
-14.08 |
| |
|
instrument |
freshest |
⇓ Δday |
10/10/11 |
⇓ Δwk |
7/25/11 |
prc diff |
⇓ Δ11 |
Curr |
⇓∅-RS |
| | |
|
|
|
L |
|
Steico |
26.850 |
8/12/24 |
0.56 |
7.420 |
|
10.580 |
-3.160 |
-29.87 |
EUR |
-20.34 |
| | |
|
|
|
|
|
Svenska Cellulosa B |
137.050 |
8/12/24 |
0.81 |
17.870 |
|
19.300 |
-1.430 |
-7.41 |
SEK |
-9.40 |
| | |
|
|
|
|
|
Tesla Motors |
197.490 |
8/12/24 |
-1.26 |
1.859 |
|
1.899 |
-0.041 |
-2.14 |
USD |
8.91 |
| | |
|
|
|
|
|
Tomra Systems |
158.200 |
8/12/24 |
0.13 |
19.150 |
|
24.400 |
-5.250 |
-21.52 |
NOK |
-5.37 |
| | |
|
|
|
L |
|
United Natural Foods |
12.320 |
8/12/24 |
-1.28 |
38.600 |
|
41.750 |
-3.150 |
-7.54 |
USD |
-3.16 |
| | |
|
|
|
|
|
Vestas Wind Systems |
152.250 |
8/12/24 |
-7.76 |
17.520 |
|
24.940 |
-7.420 |
-29.75 |
DKK |
-40.42 |
| NAI 30 - 26 out of 30 instruments rated - 10/10/11 / 7/25/11 - 3 did rise, Market-Ratio(11) = 11.54 % |
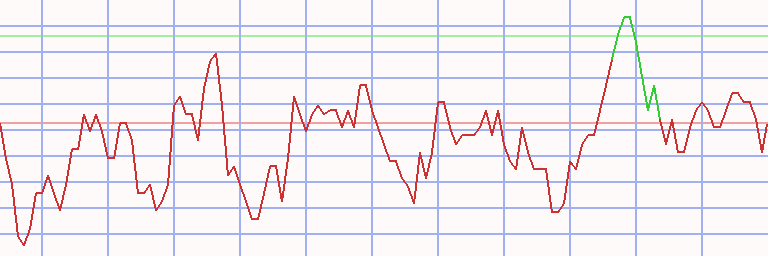
Technical Chart
Transactions NAI - Der Natur-Index * A11 - 86/52 (1)
|
⇐ |
| |
| L/S | date buy | date sell | days | | instrument | spl | pieces | Curr | prc buy | prc sell | ps short | prc diff | d % | asset | yield | |
| 1/02/06 |
1/09/06 |
7 |
|
- cash - |
| long |
1/09/06 |
5/29/06 |
140 |
|
|
|
SolarWorld |
100 |
2 |
EUR |
4,917.000 |
8,028.750 |
|
3,111.750 |
63 |
16,224 |
259 |
|
| short |
5/29/06 |
10/02/06 |
126 |
|
|
|
Boiron |
100 |
983 |
EUR |
16.500 |
17.050 |
15.950 |
-0.550 |
-3 |
15,683 |
-9 |
|
| long |
10/02/06 |
7/02/07 |
273 |
|
|
|
SunOpta |
100 |
1,312 |
CAD |
11.950 |
12.100 |
|
0.150 |
1 |
15,880 |
2 |
|
| short |
7/02/07 |
5/11/09 |
679 |
|
|
|
SolarWorld |
100 |
2 |
EUR |
5,625.000 |
3,270.000 |
9,676.032 |
4,051.032 |
72 |
23,982 |
34 |
|
| long |
5/11/09 |
2/01/10 |
266 |
|
|
|
Keurig Dr Pepper |
100 |
1,285 |
USD |
18.653 |
28.136 |
|
9.483 |
51 |
36,167 |
76 |
|
| short |
2/01/10 |
12/29/14 |
1792 |
|
|
|
SolarWorld |
100 |
19 |
EUR |
1,877.250 |
12.575 |
280,243.941 |
278,366.691 |
14,828 |
5,325,135 |
177 |
|
| long |
12/29/14 |
6/01/15 |
154 |
|
|
|
Shimano |
100 |
33,419 |
JPY |
159.340 |
176.950 |
|
17.610 |
11 |
5,913,643 |
28 |
|
| short |
6/01/15 |
4/25/16 |
329 |
|
|
|
Aixtron |
100 |
857,049 |
EUR |
6.900 |
4.108 |
11.590 |
4.690 |
68 |
9,932,860 |
78 |
|
| long |
4/25/16 |
6/13/16 |
49 |
|
|
|
Steico |
100 |
1,008,412 |
EUR |
9.850 |
10.345 |
|
0.495 |
5 |
10,432,024 |
44 |
|
| short |
6/13/16 |
2/25/19 |
987 |
|
|
|
SunOpta |
100 |
1,783,251 |
CAD |
5.850 |
5.280 |
6.482 |
0.632 |
11 |
11,558,147 |
4 |
|
| long |
2/25/19 |
4/29/19 |
63 |
|
|
|
Natura Cosmeticos |
100 |
463,531 |
BRL |
24.935 |
26.175 |
|
1.240 |
5 |
12,132,925 |
32 |
|
| short |
4/29/19 |
12/30/19 |
245 |
|
|
|
Aspen Pharmacare |
100 |
1,972,833 |
EUR |
6.150 |
7.600 |
4.700 |
-1.450 |
-24 |
9,272,318 |
-33 |
|
| long |
12/30/19 |
3/02/20 |
63 |
|
|
|
Tesla Motors |
100 |
335,386 |
USD |
27.647 |
49.575 |
|
21.928 |
79 |
16,626,662 |
2,847 |
|
| short |
3/02/20 |
6/01/20 |
91 |
|
|
|
United Natural Foods |
100 |
2,785,035 |
USD |
5.970 |
21.210 |
0.000 |
-5.970 |
-100 |
3 |
-100 |
|
| long |
6/01/20 |
11/02/20 |
154 |
|
|
|
Tesla Motors |
100 |
0 |
USD |
59.873 |
133.503 |
|
73.630 |
123 |
3 |
0 |
|
| short |
11/02/20 |
12/07/20 |
35 |
|
|
|
Interface |
100 |
0 |
USD |
6.300 |
9.130 |
3.470 |
-2.830 |
-45 |
3 |
0 |
|
| long |
12/07/20 |
7/19/21 |
224 |
|
|
|
Tesla Motors |
100 |
0 |
USD |
213.920 |
215.407 |
|
1.487 |
1 |
3 |
0 |
|
| short |
7/19/21 |
1/01/24 |
896 |
|
|
|
Ormat Technologies |
100 |
0 |
USD |
65.730 |
75.790 |
55.670 |
-10.060 |
-15 |
3 |
0 |
|
| long |
1/01/24 |
2/26/24 |
56 |
|
|
|
Steelcase |
100 |
0 |
USD |
13.520 |
12.770 |
|
-0.750 |
-6 |
3 |
0 |
|
| short |
2/26/24 |
8/12/24 |
168 |
|
|
|
Li-Cycle |
100 |
0 |
USD |
3.200 |
2.700 |
3.793 |
0.593 |
19 |
3 |
0 |
|
| accum | 1/09/06 |
8/12/24 | 7508 |
days out of 7515 invested (100%) |
-100 |
3 |
-33 |
|
Instrument Related Contribution
| instrument | L/S | date buy | date sell | days | prc buy | prc sell | ps short | prc diff | d % | | | total |
| SolarWorld | long | 1/09/06 | 5/29/06 | 140 | 4,917.00 | 8,028.75 | | 3,111.75 | 63.29 | | | |
| | short | 7/02/07 | 5/11/09 | 679 | 5,625.00 | 3,270.00 | 9,676.03 | 4,051.03 | 72.02 | | | |
| | short | 2/01/10 | 12/29/14 | 1792 | 1,877.25 | 12.58 | 280,243.94 | 278,366.69 | 14,828.43 | | | 41,831.14 |
| Tesla Motors | long | 12/30/19 | 3/02/20 | 63 | 27.65 | 49.57 | | 21.93 | 79.32 | | | |
| | long | 6/01/20 | 11/02/20 | 154 | 59.87 | 133.50 | | 73.63 | 122.98 | | | |
| | long | 12/07/20 | 7/19/21 | 224 | 213.92 | 215.41 | | 1.49 | 0.70 | | | 302.61 |
| Aixtron | short | 6/01/15 | 4/25/16 | 329 | 6.90 | 4.11 | 11.59 | 4.69 | 67.97 | | | 67.97 |
| Keurig Dr Pepper | long | 5/11/09 | 2/01/10 | 266 | 18.65 | 28.14 | | 9.48 | 50.84 | | | 50.84 |
| Li-Cycle | short | 2/26/24 | 8/12/24 | 168 | 3.20 | 2.70 | 3.79 | 0.59 | 18.52 | | | 18.52 |
| SunOpta | long | 10/02/06 | 7/02/07 | 273 | 11.95 | 12.10 | | 0.15 | 1.26 | | | |
| | short | 6/13/16 | 2/25/19 | 987 | 5.85 | 5.28 | 6.48 | 0.63 | 10.79 | | | 12.19 |
| Shimano | long | 12/29/14 | 6/01/15 | 154 | 159.34 | 176.95 | | 17.61 | 11.05 | | | 11.05 |
| Steico | long | 4/25/16 | 6/13/16 | 49 | 9.85 | 10.35 | | 0.50 | 5.03 | | | 5.03 |
| Natura Cosmeticos | long | 2/25/19 | 4/29/19 | 63 | 24.94 | 26.18 | | 1.24 | 4.97 | | | 4.97 |
| Boiron | short | 5/29/06 | 10/02/06 | 126 | 16.50 | 17.05 | 15.95 | -0.55 | -3.33 | | | -3.33 |
| Steelcase | long | 1/01/24 | 2/26/24 | 56 | 13.52 | 12.77 | | -0.75 | -5.55 | | | -5.55 |
| Ormat Technologies | short | 7/19/21 | 1/01/24 | 896 | 65.73 | 75.79 | 55.67 | -10.06 | -15.31 | | | -15.31 |
| Aspen Pharmacare | short | 4/29/19 | 12/30/19 | 245 | 6.15 | 7.60 | 4.70 | -1.45 | -23.58 | | | -23.58 |
| Interface | short | 11/02/20 | 12/07/20 | 35 | 6.30 | 9.13 | 3.47 | -2.83 | -44.92 | | | -44.92 |
| United Natural Foods | short | 3/02/20 | 6/01/20 | 91 | 5.97 | 21.21 | 0.00 | -5.97 | -100.00 | | | -100.00 |
Annotations
| 6/10/24 | NVidia | | | stock split 1:10 (ten for one) |
| 3/28/24 | EJR | | | stock split 1:3 (three for one) |
| 2/29/24 | NAI 30 | | | Component update: Geberit and Hannon Armstrong replace Li-Cycle and Umweltbank |
| 3/01/23 | NAI 30 | | | First Solar und Signify replace Acciona and Shimano |
| 8/25/22 | Tesla Motors | | | stock split 1:3 (three for one) |
| 5/27/22 | Tomra Systems | | | stock split 1:2 (two for one) |
| 7/20/21 | NVidia | | | stock split 1:4 (four for one) |
| 2/09/16 | NAI 30 | | | Smith & Nephew and Tesla Motors replace Keurig Green Mountain and SolarWorld |
| 8/17/15 | NAI 30 | | | complete analysis |
| 7/01/15 | Scatec Solar | | | monitoring started |
| 3/14/15 | NAI 30 | | | first complete analysis |
|
|