Mon, 29th Jun 2026, 0:24UTC
Assessment - Kospi 50 in Pound sterling - 1/07/24 - RS = 22
⇐
instrument
freshest
⇓ 1/07/24
⇓ 29/01/24
prc diff
⇓
⇓
Kospi 50
1.404
12/08/24
1.10
1.528
-8.16
1.382
0.147
10.61
6.94
L
Amorepacific
68.985
12/08/24
1.34
95.584
-27.83
80.641
14.942
18.53
24.41
Celltrion
114.403
12/08/24
2.04
105.308
8.64
107.423
-2.115
-1.97
5.73
L
Doosan Enerbility
10.491
12/08/24
3.67
11.412
-8.07
9.057
2.354
25.99
16.90
EcoPro Materials
48.964
12/08/24
2.76
55.600
-11.93
85.312
-29.712
-34.83
-na-
Hana Financial
34.607
12/08/24
0.33
34.435
0.50
27.432
7.003
25.53
23.63
L
HD Hyundai Heavy
119.265
12/08/24
-1.65
88.720
34.43
69.940
18.779
26.85
20.09
L
HMM
10.050
12/08/24
1.15
11.263
-10.77
11.493
-0.230
-2.00
10.05
L
Hybe
98.444
12/08/24
-0.06
114.689
-14.16
120.903
-6.214
-5.14
-14.00
Hyundai Glovis
61.148
12/08/24
0.75
137.570
-55.55
100.270
37.300
37.20
27.87
L
Hyundai Heavy
113.888
12/08/24
-1.44
91.465
24.52
67.103
24.363
36.31
31.60
Hyundai Mobis
124.985
12/08/24
2.82
141.574
-11.72
119.721
21.853
18.25
2.68
L
Hyundai Motor
139.286
12/08/24
0.21
163.596
-14.86
115.641
47.955
41.47
31.34
IBK
7.711
12/08/24
0.37
7.922
-2.67
7.154
0.769
10.75
10.16
S
Kakao
21.222
12/08/24
0.27
23.453
-9.51
32.694
-9.241
-28.27
-20.14
S
KakaoBank
12.499
12/08/24
1.39
12.012
4.05
16.347
-4.335
-26.52
-20.38
S
KakaoPay
14.272
12/08/24
2.67
15.559
-8.27
29.295
-13.736
-46.89
-37.48
KB Financial
47.191
12/08/24
0.73
45.532
3.64
32.871
12.661
38.52
30.19
Kia
58.403
12/08/24
0.20
73.561
-20.61
59.062
14.499
24.55
30.18
Korea Electric Power
11.040
12/08/24
1.37
11.171
-1.18
11.777
-0.606
-5.14
-4.19
L
Korea Zinc
296.304
12/08/24
0.78
292.300
1.37
276.096
16.203
5.87
1.28
L
Krafton
167.600
12/08/24
-0.51
156.446
7.13
125.633
30.813
24.53
32.22
KT
21.737
12/08/24
-0.26
21.107
2.98
20.545
0.563
2.74
3.61
S
KT & G
57.316
12/08/24
-0.40
49.937
14.78
52.618
-2.681
-5.10
-5.18
S
LG
45.075
12/08/24
1.03
46.047
-2.11
44.814
1.233
2.75
-7.79
instrument
freshest
⇓ 1/07/24
⇓ 29/01/24
prc diff
⇓
⇓
LG Chemical
165.884
12/08/24
1.40
203.351
-18.42
251.266
-47.914
-19.07
-28.26
L
LG Electronics
54.685
12/08/24
1.49
62.693
-12.77
55.751
6.941
12.45
4.27
S
LG Energy Solution
187.907
12/08/24
2.02
198.489
-5.33
223.183
-24.694
-11.06
-22.60
L
LG HH & HC
194.771
12/08/24
0.59
206.783
-5.81
185.641
21.143
11.39
-9.45
Lotte Chemical
46.619
12/08/24
2.13
64.523
-27.75
80.464
-15.941
-19.81
-18.30
S
Naver
91.694
12/08/24
-2.08
93.181
-1.60
125.337
-32.156
-25.66
-21.50
L
NCsoft
105.022
12/08/24
0.33
105.308
-0.27
115.287
-9.979
-8.66
-20.57
S
Posco Future M
118.979
12/08/24
1.22
153.872
-22.68
152.533
1.339
0.88
-20.30
S
Posco Holdings
187.335
12/08/24
0.61
211.932
-11.61
250.083
-38.152
-15.26
-22.20
Posco International
29.001
12/08/24
2.94
36.437
-20.41
30.684
5.753
18.75
8.03
S
S-Oil
37.353
12/08/24
-0.61
39.011
-4.25
40.794
-1.782
-4.37
-9.14
S
Samsung BioLogics
543.414
12/08/24
-1.04
434.159
25.16
472.970
-38.811
-8.21
-4.02
Samsung C&T
81.569
12/08/24
1.06
80.540
1.28
75.616
4.924
6.51
9.00
Samsung Elec-Mech
83.400
12/08/24
1.60
89.234
-6.54
84.603
4.632
5.47
3.45
Samsung Electronics
43.187
12/08/24
1.07
46.791
-7.70
43.986
2.805
6.38
7.22
Samsung F&M Ins
202.779
12/08/24
1.00
212.790
-4.70
146.325
66.464
45.42
30.13
Samsung Life
51.310
12/08/24
-0.33
50.051
2.51
38.843
11.209
28.86
11.15
Samsung SDI
182.759
12/08/24
3.06
209.930
-12.94
224.070
-14.140
-6.31
-24.46
Samsung SDS
81.055
12/08/24
0.57
87.461
-7.33
90.515
-3.054
-3.37
-1.36
Shinhan
30.946
12/08/24
0.19
27.371
13.06
23.944
3.427
14.31
16.87
S
SK Biopharmaceutical
56.515
12/08/24
7.04
45.132
25.22
55.515
-10.383
-18.70
-12.94
SK Holdings
78.766
12/08/24
0.73
89.692
-12.18
104.113
-14.421
-13.85
-7.36
L
SK Hynix
101.247
12/08/24
3.21
134.710
-24.84
79.814
54.896
68.78
61.56
SK Innovation
58.346
12/08/24
0.99
65.953
-11.54
71.123
-5.170
-7.27
-17.15
SK Telecom
31.060
12/08/24
-1.09
29.459
5.44
29.324
0.135
0.46
-1.07
instrument
freshest
⇓ 1/07/24
⇓ 29/01/24
prc diff
⇓
⇓
Woori Financial
8.437
12/08/24
0.55
8.237
2.43
7.970
0.267
3.36
6.11
Kospi 50 - 50 out of 50 instruments rated - 1/07/24 / 29/01/24 - 28 did rise, Market-Ratio(22) in GBP = 56.00 % Stock Exchange Currency: KRW ₩ South Korean won
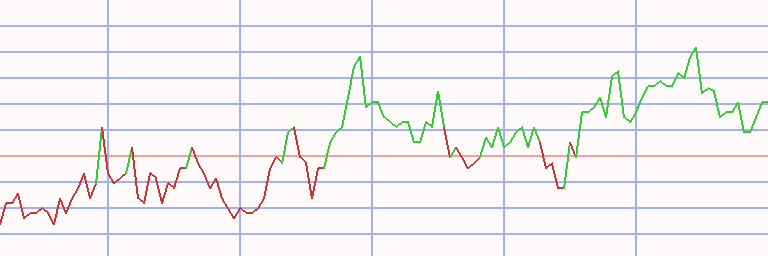
Technical Chart
Transactions Kospi 50 in Pound sterling * L22 - 39 ex 13 (1)
⇐ L/S date buy date sell days instrument spl pieces prc buy prc sell prc diff d % asset yield long
2/01/06
29/05/06
147
Naver
100
652,524
0.015
0.016
0.001
5
10,469
12
29/05/06 26/06/06 28 - cash -
26/06/06
3/07/06
7
Naver
100
628,476
0.017
0.018
0.001
8
11,346
6,523
3/07/06 10/07/06 7 - cash -
10/07/06
17/07/06
7
Korea Zinc
100
244,511
0.046
0.045
-0.002
-4
10,892
-88
17/07/06 31/07/06 14 - cash -
31/07/06
4/09/06
35
Korea Zinc
100
227,946
0.048
0.045
-0.003
-5
10,317
-43
4/09/06 23/10/06 49 - cash -
23/10/06
25/02/08
490
Hyundai Heavy
100
142,772
0.072
0.199
0.127
176
28,444
113
25/02/08 14/04/08 49 - cash -
14/04/08
1/09/08
140
LG Electronics
100
400,370
0.071
0.046
-0.025
-35
18,480
-68
1/09/08
8/09/08
7
Kia
100
2,816,397
0.007
0.007
0.000
1
18,693
82
8/09/08 23/03/09 196 - cash -
23/03/09
28/12/09
280
NCsoft
100
419,629
0.045
0.076
0.031
71
31,904
101
28/12/09
9/08/10
224
Samsung Elec-Mech
100
580,555
0.055
0.068
0.013
24
39,504
42
9/08/10
15/08/11
371
Posco Future M
100
8,282,048
0.005
0.011
0.006
126
89,296
123
15/08/11 9/01/12 147 - cash -
9/01/12
7/05/12
119
Samsung Electronics
100
7,645,796
0.012
0.015
0.003
26
112,091
101
7/05/12 14/05/12 7 - cash -
14/05/12
28/05/12
14
Samsung Electronics
100
7,877,796
0.014
0.013
-0.001
-7
104,707
-83
28/05/12 4/06/12 7 - cash -
4/06/12
25/06/12
21
Samsung Electronics
100
7,883,214
0.013
0.013
-0.001
-5
99,449
-59
25/06/12 2/07/12 7 - cash -
2/07/12
9/07/12
7
Samsung Elec-Mech
100
1,700,386
0.058
0.056
-0.003
-4
94,994
-91
9/07/12 23/07/12 14 - cash -
23/07/12
30/07/12
7
Samsung Electronics
100
6,877,606
0.014
0.014
0.000
0
95,376
23
30/07/12 13/08/12 14 - cash -
13/08/12
27/08/12
14
Samsung Electronics
100
6,529,617
0.015
0.013
-0.001
-9
86,921
-91
27/08/12 10/09/12 14 - cash -
10/09/12
28/01/13
140
Samsung Electronics
100
5,828,592
0.015
0.017
0.002
14
98,896
40
28/01/13 4/02/13 7 - cash -
4/02/13
11/02/13
7
Korea Electric Power
100
5,140,823
0.019
0.018
-0.002
-9
90,278
-99
11/02/13 25/03/13 42 - cash -
25/03/13
1/04/13
7
SK Telecom
100
4,260,563
0.021
0.022
0.001
4
93,764
621
1/04/13 22/04/13 21 - cash -
22/04/13
29/04/13
7
LG Electronics
100
1,782,625
0.053
0.051
-0.001
-2
91,754
-68
29/04/13 20/05/13 21 - cash -
20/05/13
10/06/13
21
SK Telecom
100
3,617,038
0.025
0.024
-0.001
-5
87,447
-57
10/06/13 29/07/13 49 - cash -
29/07/13
12/08/13
14
SK Telecom
100
3,315,227
0.026
0.024
-0.002
-7
81,027
-86
12/08/13 19/08/13 7 - cash -
19/08/13
26/08/13
7
HMM
100
1,069,747
0.076
0.064
-0.011
-15
68,749
-100
26/08/13 2/09/13 7 - cash -
2/09/13
10/02/14
161
Naver
100
1,301,292
0.053
0.083
0.031
58
108,595
182
10/02/14 17/02/14 7 - cash -
17/02/14
3/03/14
14
Naver
100
1,289,777
0.084
0.091
0.007
8
117,476
676
L/S date buy date sell days instrument spl pieces prc buy prc sell prc diff d % asset yield
3/03/14 19/05/14 77 - cash -
19/05/14
2/06/14
14
Amorepacific
100
1,456,476
0.081
0.085
0.004
5
123,263
250
2/06/14 9/06/14 7 - cash -
9/06/14
29/12/14
203
Amorepacific
100
1,452,482
0.085
0.131
0.046
54
190,346
118
29/12/14 2/02/15 35 - cash -
2/02/15
9/02/15
7
Amorepacific
100
1,178,146
0.162
0.171
0.009
6
201,425
1,811
9/02/15 16/02/15 7 - cash -
16/02/15
23/02/15
7
Amorepacific
100
1,215,701
0.166
0.168
0.002
1
203,976
93
23/02/15 9/03/15 14 - cash -
9/03/15
16/03/15
7
Amorepacific
100
1,224,010
0.167
0.181
0.014
9
221,637
7,493
16/03/15 23/03/15 7 - cash -
23/03/15
6/04/15
14
Amorepacific
100
1,172,405
0.189
0.201
0.012
7
236,048
417
6/04/15 13/04/15 7 - cash -
13/04/15
6/07/15
84
Amorepacific
100
1,031,528
0.229
0.243
0.014
6
250,720
30
6/07/15 3/08/15 28 - cash -
3/08/15
10/08/15
7
Amorepacific
100
1,116,108
0.225
0.230
0.005
2
256,550
232
10/08/15 17/08/15 7 - cash -
17/08/15
24/08/15
7
Amorepacific
100
1,243,027
0.206
0.179
-0.028
-13
221,927
-100
24/08/15 31/08/15 7 - cash -
31/08/15
7/09/15
7
Amorepacific
100
1,064,355
0.209
0.180
-0.028
-14
191,924
-100
7/09/15 19/10/15 42 - cash -
19/10/15
16/11/15
28
Lotte Chemical
100
1,257,694
0.153
0.126
-0.026
-17
158,787
-92
16/11/15
14/03/16
119
LG Chemical
100
960,382
0.165
0.178
0.013
8
171,358
26
14/03/16 28/03/16 14 - cash -
28/03/16
29/08/16
154
SK Innovation
100
1,759,370
0.097
0.095
-0.003
-3
166,430
-7
29/08/16
19/09/16
21
Hyundai Heavy
100
1,859,714
0.089
0.093
0.004
4
173,523
107
19/09/16 3/10/16 14 - cash -
3/10/16
5/12/16
63
Naver
100
1,392,277
0.125
0.102
-0.023
-18
141,925
-69
5/12/16
15/01/18
406
SK Hynix
100
4,657,352
0.030
0.050
0.019
63
231,145
55
15/01/18
26/03/18
70
Posco Future M
100
7,593,156
0.030
0.031
0.001
2
235,009
9
26/03/18 23/04/18 28 - cash -
23/04/18
11/06/18
49
Samsung BioLogics
100
746,936
0.315
0.292
-0.023
-7
217,939
-43
11/06/18 1/10/18 112 - cash -
1/10/18
8/10/18
7
Posco Future M
100
4,564,269
0.048
0.043
-0.005
-10
196,435
-100
8/10/18 18/03/19 161 - cash -
18/03/19
22/04/19
35
Posco Future M
100
4,767,537
0.041
0.037
-0.004
-10
175,924
-68
22/04/19
20/05/19
28
Kia
100
6,083,890
0.029
0.028
-0.001
-3
170,822
-32
20/05/19 3/06/19 14 - cash -
3/06/19
24/06/19
21
Hyundai Glovis
100
1,574,079
0.109
0.111
0.002
2
174,007
38
24/06/19 28/10/19 126 - cash -
28/10/19
11/11/19
14
Naver
100
1,662,329
0.105
0.109
0.004
4
181,014
180
11/11/19 18/11/19 7 - cash -
18/11/19
2/12/19
14
Naver
100
1,531,156
0.118
0.112
-0.006
-5
171,471
-76
2/12/19 9/12/19 7 - cash -
9/12/19
24/02/20
77
Naver
100
1,531,340
0.112
0.117
0.005
4
179,056
23
L/S date buy date sell days instrument spl pieces prc buy prc sell prc diff d % asset yield
24/02/20 27/07/20 154 - cash -
27/07/20
11/10/21
441
Kakao
100
4,219,052
0.042
0.072
0.030
70
304,757
55
11/10/21 2/05/22 203 - cash -
2/05/22
9/05/22
7
Woori Financial
100
32,277,829
0.009
0.010
0.000
3
314,092
382
9/05/22 15/08/22 98 - cash -
15/08/22
22/08/22
7
Posco Future M
100
3,065,224
0.102
0.101
-0.001
-1
310,081
-49
22/08/22 21/11/22 91 - cash -
21/11/22
26/12/22
35
Posco Future M
100
2,228,627
0.139
0.120
-0.019
-14
267,359
-79
26/12/22 23/01/23 28 - cash -
23/01/23
8/05/23
105
Posco Future M
100
2,224,111
0.120
0.193
0.073
60
428,800
417
8/05/23 15/05/23 7 - cash -
15/05/23
9/10/23
147
Posco Future M
100
2,363,918
0.181
0.191
0.010
5
451,376
14
9/10/23 16/10/23 7 - cash -
16/10/23
23/10/23
7
Posco International
100
11,022,706
0.041
0.037
-0.004
-9
409,000
-99
23/10/23 6/11/23 14 - cash -
6/11/23
13/11/23
7
Posco International
100
10,067,785
0.041
0.036
-0.005
-12
361,299
-100
13/11/23 20/11/23 7 - cash -
20/11/23
1/04/24
133
Posco International
100
9,818,994
0.037
0.031
-0.006
-16
305,184
-37
1/04/24
12/08/24
133
SK Hynix
100
2,794,840
0.109
0.101
-0.008
-7
282,968
-19
accum 2/01/06
12/08/24 5439
days out of 7483 invested (73%)
2,730
282,968
25
Instrument Related Contribution
instrument L/S date buy date sell days prc buy prc sell prc diff d % total Hyundai Heavy long 23/10/06 25/02/08 490 0.07 0.20 0.13 175.69 29/08/16 19/09/16 21 0.09 0.09 0.00 4.26 187.44 Posco Future M 9/08/10 15/08/11 371 0.00 0.01 0.01 126.04 15/01/18 26/03/18 70 0.03 0.03 0.00 1.67 1/10/18 8/10/18 7 0.05 0.04 -0.00 -9.87 18/03/19 22/04/19 35 0.04 0.04 -0.00 -10.44 15/08/22 22/08/22 7 0.10 0.10 -0.00 -1.28 21/11/22 26/12/22 35 0.14 0.12 -0.02 -13.78 23/01/23 8/05/23 105 0.12 0.19 0.07 60.38 15/05/23 9/10/23 147 0.18 0.19 0.01 5.26 166.60 NCsoft 23/03/09 28/12/09 280 0.04 0.08 0.03 70.67 70.67 Kakao 27/07/20 11/10/21 441 0.04 0.07 0.03 70.20 70.20 Amorepacific 19/05/14 2/06/14 14 0.08 0.08 0.00 4.93 9/06/14 29/12/14 203 0.08 0.13 0.05 54.42 2/02/15 9/02/15 7 0.16 0.17 0.01 5.82 16/02/15 23/02/15 7 0.17 0.17 0.00 1.27 9/03/15 16/03/15 7 0.17 0.18 0.01 8.66 23/03/15 6/04/15 14 0.19 0.20 0.01 6.50 13/04/15 6/07/15 84 0.23 0.24 0.01 6.22 3/08/15 10/08/15 7 0.22 0.23 0.01 2.33 17/08/15 24/08/15 7 0.21 0.18 -0.03 -13.50 31/08/15 7/09/15 7 0.21 0.18 -0.03 -13.52 63.37 Naver 2/01/06 29/05/06 147 0.02 0.02 0.00 4.69 26/06/06 3/07/06 7 0.02 0.02 0.00 8.37 2/09/13 10/02/14 161 0.05 0.08 0.03 57.96 17/02/14 3/03/14 14 0.08 0.09 0.01 8.18 3/10/16 5/12/16 63 0.12 0.10 -0.02 -18.21 28/10/19 11/11/19 14 0.10 0.11 0.00 4.03 18/11/19 2/12/19 14 0.12 0.11 -0.01 -5.27 9/12/19 24/02/20 77 0.11 0.12 0.00 4.42 63.18 instrument L/S date buy date sell days prc buy prc sell prc diff d % total SK Hynix 5/12/16 15/01/18 406 0.03 0.05 0.02 62.86 1/04/24 12/08/24 133 0.11 0.10 -0.01 -7.28 51.01 Samsung Elec-Mech 28/12/09 9/08/10 224 0.05 0.07 0.01 23.82 2/07/12 9/07/12 7 0.06 0.06 -0.00 -4.48 18.28 Samsung Electronics 9/01/12 7/05/12 119 0.01 0.01 0.00 25.53 14/05/12 28/05/12 14 0.01 0.01 -0.00 -6.59 4/06/12 25/06/12 21 0.01 0.01 -0.00 -5.02 23/07/12 30/07/12 7 0.01 0.01 0.00 0.40 13/08/12 27/08/12 14 0.01 0.01 -0.00 -8.87 10/09/12 28/01/13 140 0.01 0.02 0.00 13.78 15.95 LG Chemical 16/11/15 14/03/16 119 0.17 0.18 0.01 7.92 7.92 Woori Financial 2/05/22 9/05/22 7 0.01 0.01 0.00 3.06 3.06 Hyundai Glovis 3/06/19 24/06/19 21 0.11 0.11 0.00 1.86 1.86 Kia 1/09/08 8/09/08 7 0.01 0.01 0.00 1.15 22/04/19 20/05/19 28 0.03 0.03 -0.00 -2.90 -1.78 SK Innovation 28/03/16 29/08/16 154 0.10 0.09 -0.00 -2.88 -2.88 Samsung BioLogics 23/04/18 11/06/18 49 0.31 0.29 -0.02 -7.26 -7.26 SK Telecom 25/03/13 1/04/13 7 0.02 0.02 0.00 3.86 20/05/13 10/06/13 21 0.03 0.02 -0.00 -4.69 29/07/13 12/08/13 14 0.03 0.02 -0.00 -7.34 -8.28 Korea Electric Power 4/02/13 11/02/13 7 0.02 0.02 -0.00 -8.72 -8.72 Korea Zinc 10/07/06 17/07/06 7 0.05 0.04 -0.00 -4.01 31/07/06 4/09/06 35 0.05 0.05 -0.00 -5.27 -9.07 HMM 19/08/13 26/08/13 7 0.08 0.06 -0.01 -15.15 -15.15 Lotte Chemical 19/10/15 16/11/15 28 0.15 0.13 -0.03 -17.27 -17.27 instrument L/S date buy date sell days prc buy prc sell prc diff d % total Posco International 16/10/23 23/10/23 7 0.04 0.04 -0.00 -9.39 6/11/23 13/11/23 7 0.04 0.04 -0.00 -11.66 20/11/23 1/04/24 133 0.04 0.03 -0.01 -15.53 -32.39 LG Electronics 14/04/08 1/09/08 140 0.07 0.05 -0.02 -35.03 22/04/13 29/04/13 7 0.05 0.05 -0.00 -2.14 -36.42
Annotations
8/03/24 Kospi 50 Component update: 8/10/18 Naver stock split 1:5 (five for one) 6/06/18 Kospi 50 Celltrion, Kakao, Netmarble and Samsung Biologics replace KCC, Orion Confectionary, Samsung Card and 4/05/18 Samsung Electronics stock split 1:50 (fifty for one) 22/12/16 Kospi 50 CJ, Hanmi Science and Korea Aerospace replace DSME, Hyunday E&C and Samsung Heavy 31/03/16 Kospi 50 Samsung C&T replaces Cheil 1/09/15 Kospi 50 Orion Confectionery replaces Samsung C&T 19/08/15 Kospi 50 complete analysis 3/08/15 Kospi 50 KCC replaces SK Holdings 12/06/15 Kospi 50 Amorepacific Group and Coway replace Doosan Heavy (DHICO) and OCI 8/05/15 Amorepacific forward stock split 1:10 (ten for one) 13/03/15 Kospi 50 Cheil Industries and Samsung SDS replace Daewoo E&C and Samsung Securities 18/02/15 Kospi 50 Hyundai Merchant Marine, Samsung Engineering and Woori Finance were replaced by Hankock Tire, SK C&C and Woori
write an annotation